Question

Graphics partially work

  • 18 April 2024
  • 8 replies
  • 47 views

Badge +1

Hello,


I configured a fresh install of Centreon version 23.10.6 few months ago and I'm experiencing a strange problem with the service graphs.
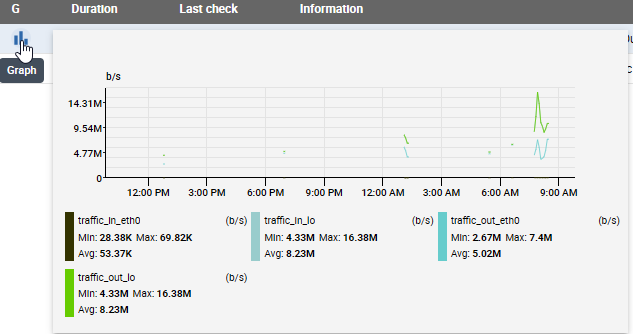
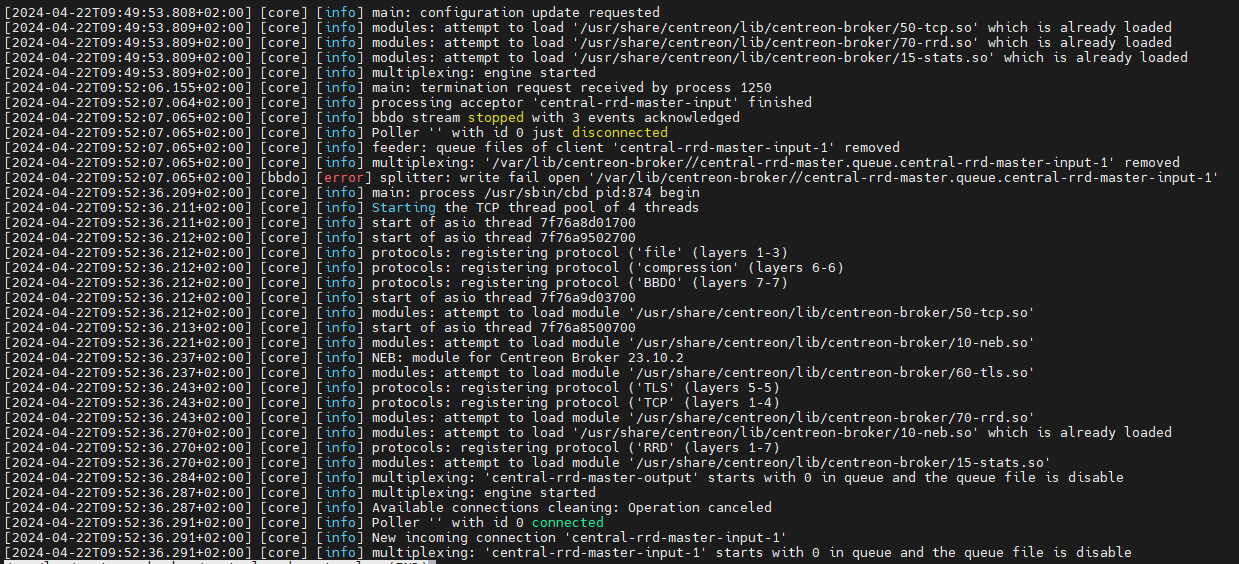
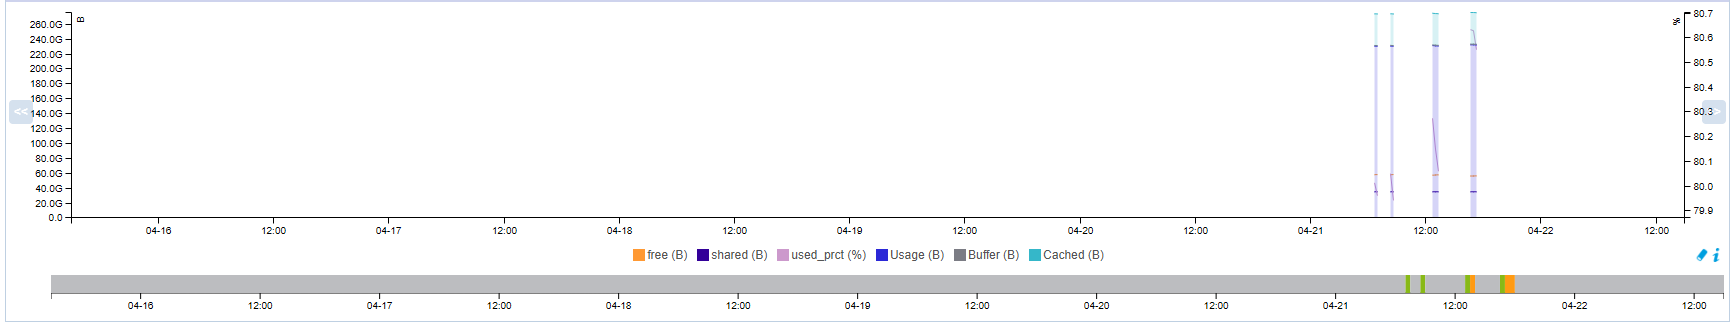
Some of them stop filling up after a random time but information collected are still correct, only the graph is impacted. SNMP v2c and v3 with a snmp user have been configured and tested on Windows and Linux to contact monitored servers. This happens randomly on Windows or Linux, sometimes in the same subnet (so not a firewall issue), sometimes not, and randomly on SNMP v2 or v3. On the same monitored host, not all services are impacted.

When I restart the poller, graphics works for about 1 or 2 hours, then stop filling up.
Does anyone have any ideas?

Thank you in advance,
Regards.


8 replies

Userlevel 6
Badge +19

HI @itadmin so the monitoring of the resources in sNMPv2/v3 are ok (no UNKNOWN status) but associated graph stop randomly some times?

Can you check if you have enougth space on the file system where are stored the graph: /var/lib/centreon/metrics?

Do you have error in /var/log/centreon-broker/central-rrd-master.log on the central server?

Badge +1

Hello,


Thank you for your reply.

Exactly, they stop working randomly as in this picture on the last day

Disk space is ok on the VM.
After restarting the poller I have this error:

I though it was maybe a permission issue on the folder but I think it seems ok:
 

The file above does not exist in this folder.

Thank you in advance,
Regards

Userlevel 6
Badge +19

Do you use rrdcached?

Do you have only one cbd process managing RRD?

# ps aux | grep cbd
centreo+ 156 2.5 0.7 1080192 31580 ? Sl Apr21 31:12 /usr/sbin/cbd /etc/centreon-broker/central-broker.json
centreo+ 157 1.7 0.8 946508 32940 ? Sl Apr21 21:16 /usr/sbin/cbd /etc/centreon-broker/central-rrd.json


Badge +1

I don’t have configured anything regarding the rrdcached with this installation, so I don’t know (and I don’t have configure it on previous centreon installations). I followed official documentation for the installation


Only one process for the RRD:

# ps aux | grep cbd
centreo+ 873 0.3 0.4 943592 37536 ? Sl 09:52 0:22 /usr/sbin/cbd /etc/centreon-broker/central-broker.json
centreo+ 874 0.2 0.3 835740 30188 ? Sl 09:52 0:15 /usr/sbin/cbd /etc/centreon-broker/central-rrd.json


Userlevel 6
Badge +19

Can you go to “Monitoring > Performance > Graph”, select you service and display graph for last 7 days and make a print screen?

Badge +1

Of course:


Userlevel 6
Badge +19

As you can see, most of times the status of this service is UNKNOWN. So if you look in /var/log/centreon-engine/centengine.log, you will see UNKNOWN logs for this service.

It is most a SNMP stability issue on your resource/network than a problem on Centreon.

Userlevel 5
Badge +11

Hi @itadmin! Have you managed to solve your problem? If so, don't forget to click on BEST ANSWER. Or simply tell us how you personally managed to solve this issue. This will help other people with the same problem to easily find the solution. Thank you 

Reply