Question

Centreon 24 - gorgone-proxy High CPU usage

  • 12 June 2024
  • 6 replies
  • 214 views

Hello everybody,
I have installed a Centreon 24.04.2 Central server with several pollers.
I use the  ZMQ revese flow from the pollers to the Central.

I have enabled TLS encryption (forced to “Yes”) with self made certificates on the Broker configuration for the communications between pollers and the Central (Input on the Central and Output on the poller).

Everything is Green on the Poller in the GUI. I can Reload/restart/DoCheck on the poller, All work well.

However, I have noticed High CPU (99%) usage for the gorgone-proxy process on the Central.

We have and old Centreon 21.04 also with several pollers and have no problem of CPU.

Do I have missed something ? Or Did I make something wrong ?

Thank you for your answer.

Best Regards
Pierre

6 replies

Badge +1

Hello @vivecentreon  ,


There is 2 main possibility for this to append :

  • Some of the gorgone module are not loaded correclty :

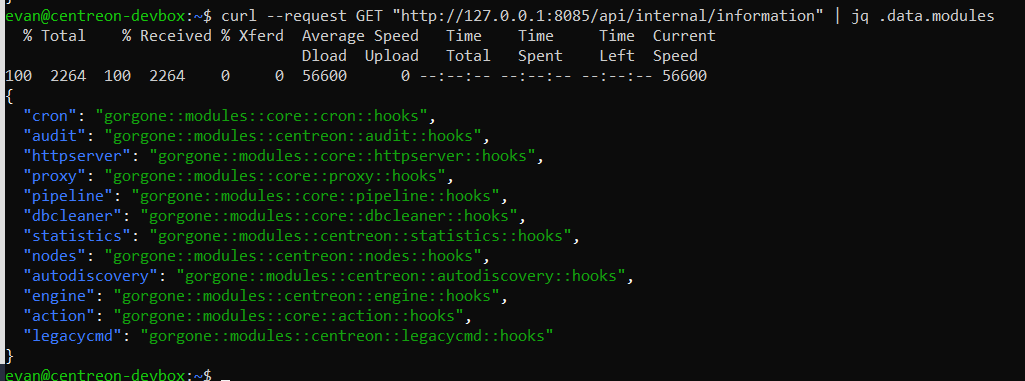
Check with this api call the module proxy, node and register are correctly loaded

curl --request GET "http://127.0.0.1:8085/api/internal/information" | jq .
  • a poller is configured in the central but don’t respond :

please check every poller configured in the web app is correctly responding

you can list all poller gorgone see with this request on the centreon database :

SELECT id, name, localhost, ns_ip_address, gorgone_port, remote_id, remote_server_use_as_proxy, gorgone_communication_type
FROM nagios_server
WHERE ns_activate = '1'


you can check all poller gorgone see correctly respond with this api and the last time a poller responded :

curl http://127.0.0.1:8085/api/internal/constatus


Userlevel 1
Badge +2

Hello

Thank you for your answer.

I don’t see something strange. All the Pollers are Green in the Gui and work normally (one host only at the moment).


Here are the result of the Queries:
 

[root@ ~]# curl --request GET "http://127.0.0.1:8085/api/internal/information" | jq .data.modules
% Total % Received % Xferd Average Speed Time Time Time Current
Dload Upload Total Spent Left Speed
100 2642 100 2642 0 0 645k 0 --:--:-- --:--:-- --:--:-- 645k
{
"engine": "gorgone::modules::centreon::engine::hooks",
"nodes": "gorgone::modules::centreon::nodes::hooks",
"cron": "gorgone::modules::core::cron::hooks",
"legacycmd": "gorgone::modules::centreon::legacycmd::hooks",
"dbcleaner": "gorgone::modules::core::dbcleaner::hooks",
"httpserver": "gorgone::modules::core::httpserver::hooks",
"statistics": "gorgone::modules::centreon::statistics::hooks",
"register": "gorgone::modules::core::register::hooks",
"autodiscovery": "gorgone::modules::centreon::autodiscovery::hooks",
"action": "gorgone::modules::core::action::hooks",
"audit": "gorgone::modules::centreon::audit::hooks",
"proxy": "gorgone::modules::core::proxy::hooks"
}


MariaDB [centreon]> SELECT id, name, localhost, ns_ip_address, gorgone_port, remote_id, remote_server_use_as_proxy, gorgone_communication_type FROM nagios_server WHERE ns_activate = '1';
+----+-----------------+-----------+----------------+--------------+-----------+----------------------------+----------------------------+
| id | name | localhost | ns_ip_address | gorgone_port | remote_id | remote_server_use_as_proxy | gorgone_communication_type |
+----+-----------------+-----------+----------------+--------------+-----------+----------------------------+----------------------------+
| 1 | Central | 1 | 127.0.0.1 | 5556 | NULL | 1 | 1 |
| 2 | 1-VM-POLLER24 | 0 | Public_ip_1 | 5556 | NULL | 1 | 1 |
| 3 | 2-VM-POLLER24 | 0 | Public_ip_2 | 5556 | NULL | 1 | 1 |
| 4 | 3-VM-POLLER24 | 0 | Public_ip_3 | 5556 | NULL | 1 | 1 |
| 5 | 3-VM-POLLER24 | 0 | Public_ip_4 | 5556 | NULL | 1 | 1 |
| 6 | 4-VM-POLLER24 | 0 | Public_ip_5 | 5556 | NULL | 1 | 1 |
+----+-----------------+-----------+----------------+--------------+-----------+----------------------------+----------------------------+
6 rows in set (0.000 sec)

MariaDB [centreon]>
[root@~]# curl http://127.0.0.1:8085/api/internal/constatus | jq .
% Total % Received % Xferd Average Speed Time Time Time Current
Dload Upload Total Spent Left Speed
100 1102 100 1102 0 0 269k 0 --:--:-- --:--:-- --:--:-- 269k
{
"action": "constatus",
"message": "ok",
"data": {
"6": {
"type": "pull",
"ping_timeout": 0,
"next_ping": 1719235508,
"in_progress_ping_pull": 1719235448,
"nodes": {},
"last_ping_sent": 1719235448,
"in_progress_ping": 0,
"ping_failed": 1,
"ping_ok": 7,
"last_ping_recv": 1719235448
},
"2": {
"last_ping_sent": 1719235408,
"in_progress_ping": 0,
"ping_failed": 1,
"ping_ok": 7,
"last_ping_recv": 1719235448,
"type": "pull",
"in_progress_ping_pull": 1719235408,
"next_ping": 1719235468,
"ping_timeout": 0,
"nodes": {}
},
"4": {
"last_ping_recv": 1719235448,
"ping_ok": 6,
"ping_failed": 1,
"last_ping_sent": 1719235408,
"in_progress_ping": 0,
"nodes": {},
"in_progress_ping_pull": 1719235408,
"ping_timeout": 0,
"next_ping": 1719235468,
"type": "pull"
},
"5": {
"in_progress_ping_pull": 1719235408,
"ping_timeout": 0,
"next_ping": 1719235468,
"type": "pull",
"nodes": {},
"last_ping_sent": 1719235408,
"in_progress_ping": 0,
"last_ping_recv": 1719235448,
"ping_ok": 6,
"ping_failed": 1
},
"3": {
"ping_timeout": 0,
"next_ping": 1719235508,
"in_progress_ping_pull": 1719235448,
"type": "pull",
"nodes": {},
"last_ping_sent": 1719235448,
"in_progress_ping": 0,
"last_ping_recv": 1719235448,
"ping_failed": 1,
"ping_ok": 7
}
}
}


Pierre

Userlevel 1
Badge +2

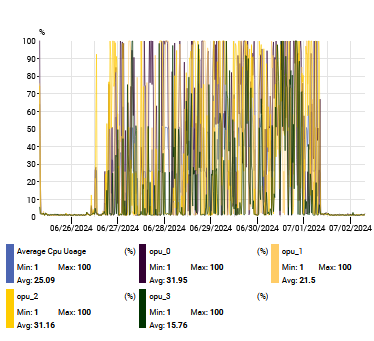
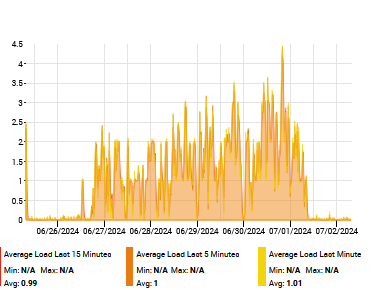
Hello
Here are the CPU & Load graphs of the Central server:


When I have disabled all Pollers with the Gui, we can see that the CPU and Load goes down to almost zero. When the Pollers are enabled, the CPU & Load goes High.

I have update Central and Poller to lastest version.

Does anyboy else have the same trouble and was abble to fix it ?

Regards

Pierre


Userlevel 1
Badge +2

Hello everybody
 

I have postponed my migration from 21 to latest 24 version due to the gogrgoned-proxy issue that I have.


I have 1 Central with 6 remote pollers (reverse flow).
When I enable the pollers (with only 1 host monitored each poller, in fact the loller itseld), the CPU goes high after one hour on the Central.


Am I the only one to have this problem ?


Thank you in advance.


Pierre

Badge +2

Hi @vivecentreon,

I just saw your issue, and I had this problem I think when updating my test platform.

I don’t remember exactly what I did but can you check that your Central’s Gorgone is using the register module as such :

    - name: register
package: "gorgone::modules::core::register::hooks"
enable: true
config_file: /etc/centreon-gorgone/nodes-register-override.yml

(I put it before nodes and proxy modules)

And that you have all your Pollers in the config file like :

nodes:
- id: 7
type: pull
prevail: 1

- id: 8
type: pull
prevail: 1

And that this config file is readable by Gorgone like 640/centreon-gorgone.

If you set logging level to debug and restart gorgoned, you should have logs like:

2024-08-19 10:53:19 - INFO - [core] Module 'register' is loading
2024-08-19 10:53:19 - INFO - [core] Module 'register' is loaded
2024-08-19 10:53:20 - DEBUG - [register] internal message: [REGISTERNODES] [] [] {"nodes":[{"prevail":"1","type":"pull","id":"7"}]}
2024-08-19 10:53:20 - DEBUG - [nodes] internal message: [REGISTERNODES] [] [] {"nodes":[{"id":"7","port":5556,"type":"push_zmq","address":"10.2.3.4"}]}
2024-08-19 10:53:20 - DEBUG - [core] Message received internal - [REGISTERNODES] [] [] {"nodes":[{"prevail":"1","type":"pull","id":"7"}]}
2024-08-19 10:53:20 - INFO - [proxy] Node '7' is registered

Logs will show that nodes module try to register Poller but register module configuration will prevail.

And you will see this log every minute:

2024-08-19 11:01:15 - DEBUG - [core] Message received external - [REGISTERNODES] [] [] {"nodes":[{"identity":"gorgone-7-a23434674e3e90da6d75806d","type":"pull","id":"7"}]}
2024-08-19 11:01:15 - INFO - [proxy] cannot override node '7' registration: prevails!!!

As I said I don’t remember exactly what was the problem but I think the proxy module was trying to access Gorgone’s Poller, which was not possible, because of misconfiguration or right issue.

Userlevel 1
Badge +2

Hello Stewart

Thank you for the answer.
I have try what you said but everything was already like that.

However I have also noticed in the log this kinf of line (every 10 minutes for each poller)

[nodes] internal message: [REGISTERNODES] [] [] {"nodes":[{"id":"7","port":5556,"type":"push_zmq","address":"xx.xx.xx.xx"}

It seems that the nodes module of the Central Server try to connect the my remote pollers with public IP (which is impossible).

Finally, I have disabled the nodes module on the Central Server and since then, everything seems to run smoothly (CPU around 1%).

I will check on the next days when activating other remote pollers to see if it changes.


Best regards


Pierre


Reply