Hello

I’m trying to make dashboard filtered on a host group (or a host category)

I want the “condensed”  view of the status grid widget

the host group has only 2 members.


‘Standard’ (non condensed) I have my 2 hosts
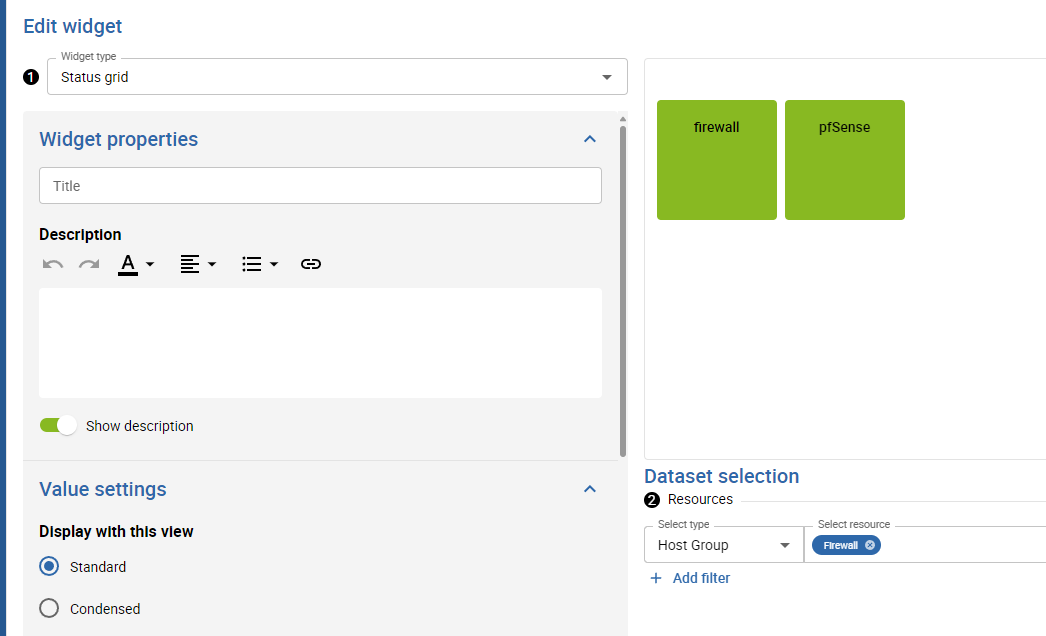
 

if I use Condensed , the total in the tile is wrong and is counting ALL the host without filtering. it should display 2 in green, it says 6...

(this is a test platform with IT-100 edition, 24.04, latest patch from last week)


tested that on 2 different platform, I have the same behaviour. is anyone else getting the same result?

Hello !
We do have the same problem on 24.04.7 ! 
We remark it on Warning  but it’s similar : like the count is 2 times or 2times+1 more on Grid than in reality


hello

I had forgotten this post, as if was fixed with the patch, I only have that dashboard for host (up and down), no services

are you saying the issue is still here on the services tiles? (can you send a screenshot?)


edit: i just add a test dashboard on a centreon test machine

the numbers are ok for me and this is 24.04.7


Hi 

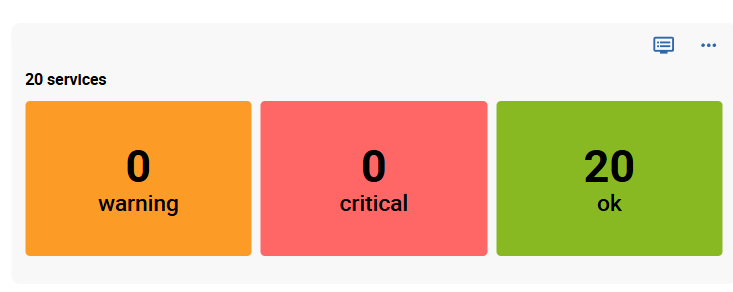
just test it on 24.04.7 with service :
I make the grid with a filter for One Host

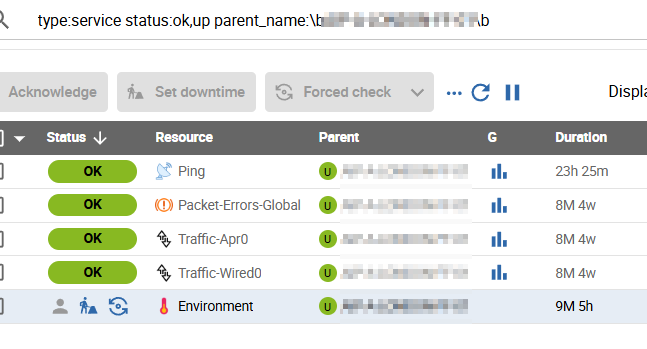
but clicking on the 20 ok I get (the reality) : 


I just remark that 20 is the number of Metric associated to this host..


Maybe the widget count the numbe of metric instead of number of services ? I have to check if it’s just by chance


I just tried to make a dashboard filtered on a single host, it has 8 services and the dashboard report only 8.

quick question, did you update in 24.04.7 recently ? (sometimes there is a cache to purge after the update)


Reply