I notice that the check process of my Centreon-engine (22.04.0) of my central server is broken from time to time, without disturbing my supervision.
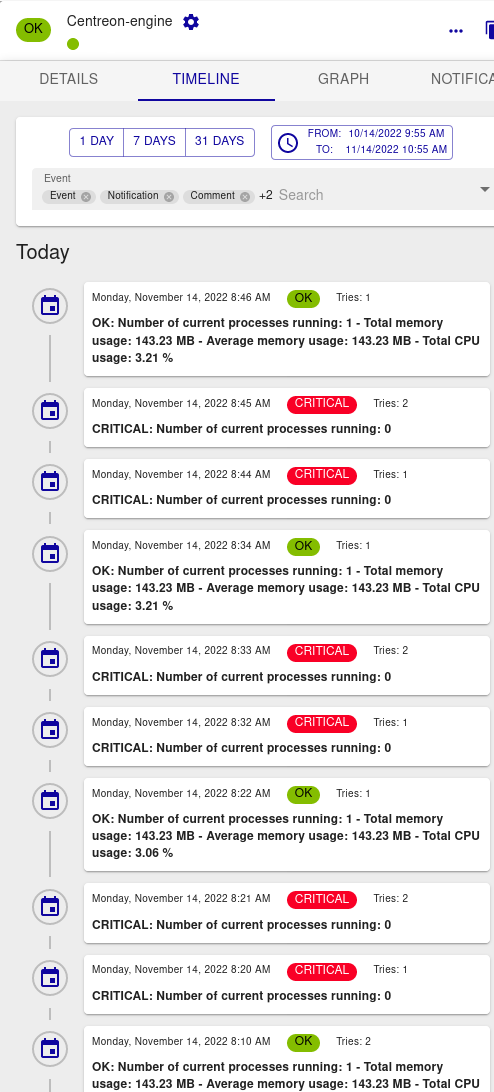
[2022-11-08T12:59:52.390+00:00] [events] [info] [25017] SERVICE ALERT: Central;Centreon-engine;OK;HARD;1;OK: Number of current processes running: 1 - Total memory usage: 153.07 MB - Average memory usage: 153.07 MB - Total CPU usage: 3.13 %
[2022-11-08T13:09:52.985+00:00] [events] [info] [25017] SERVICE ALERT: Central;Centreon-engine;CRITICAL;SOFT;1;CRITICAL: Number of current processes running: 0
[2022-11-08T13:10:52.390+00:00] [events] [info] [25017] SERVICE ALERT: Central;Centreon-engine;CRITICAL;SOFT;2;CRITICAL: Number of current processes running: 0
[2022-11-08T13:11:52.856+00:00] [events] [info] [25017] SERVICE ALERT: Central;Centreon-engine;OK;HARD;1;OK: Number of current processes running: 1 - Total memory usage: 153.07 MB - Average memory usage: 153.07 MB - Total CPU usage: 3.02 %
[2022-11-08T13:31:52.028+00:00] [events] [info] [25017] SERVICE ALERT: Central;Centreon-engine;CRITICAL;SOFT;1;CRITICAL: Number of current processes running: 0
[2022-11-08T13:32:52.006+00:00] [events] [info] [25017] SERVICE ALERT: Central;Centreon-engine;OK;SOFT;2;OK: Number of current processes running: 1 - Total memory usage: 153.07 MB - Average memory usage: 153.07 MB - Total CPU usage: 3.17 %
[2022-11-08T13:42:52.009+00:00] [events] [info] [25017] SERVICE ALERT: Central;Centreon-engine;OK;HARD;1;OK: Number of current processes running: 1 - Total memory usage: 153.07 MB - Average memory usage: 153.07 MB - Total CPU usage: 3.14 %
[2022-11-08T14:02:52.318+00:00] [events] [info] [25017] SERVICE ALERT: Central;Centreon-engine;CRITICAL;SOFT;1;CRITICAL: Number of current processes running: 0
[2022-11-08T14:03:52.495+00:00] [events] [info] [25017] SERVICE ALERT: Central;Centreon-engine;OK;SOFT;2;OK: Number of current processes running: 1 - Total memory usage: 153.07 MB - Average memory usage: 153.07 MB - Total CPU usage: 3.14 %
I think, i have no problem with my RAM:
>root@Central]# free -m
total used free shared buff/cache available
Mem: 23889 5178 17146 40 1564 18293
Swap: 0 0 0
I check ~ 6 000 services and 300 hosts
Have you seen this problem before ?
Thank you