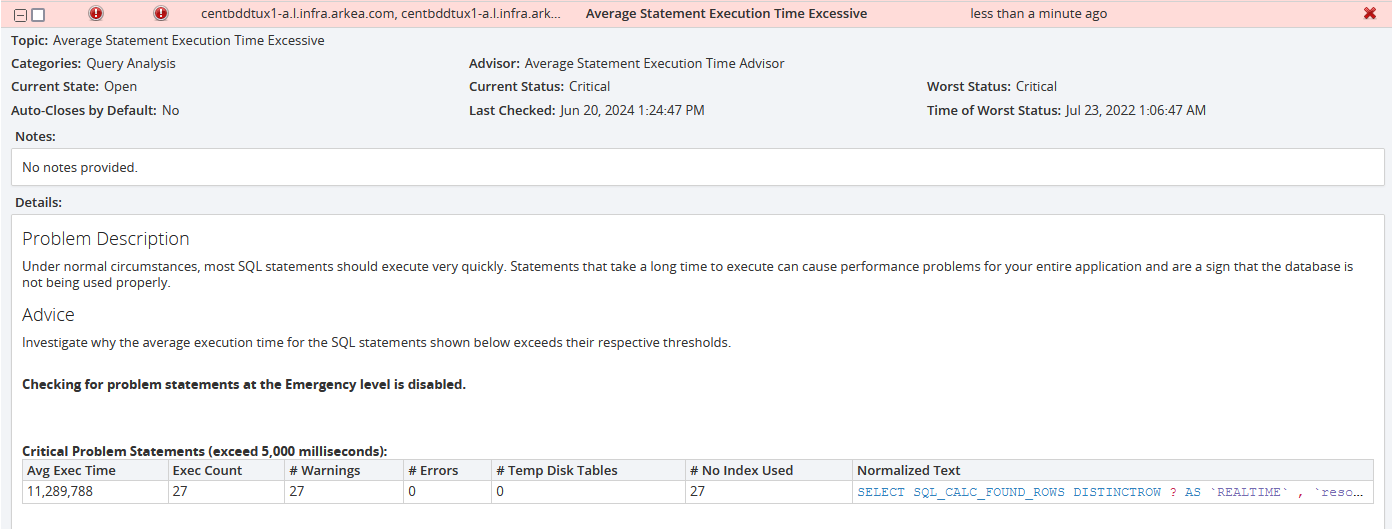
Hello,
Since upgrading to Centreon 23.10 (since 21.10), I've been experiencing frequent slowdowns in the Web UI.
From time to time, I have to restart the Centreon server to restore service.
Analysis has shown that a very specific request is the cause. This query crushes the performance of the MySQL server. It seems that the indexes are not being used (FULL SCAN).
The query is attached.
Can anyone help me identify the cause, usage or process that triggers this query?
Here is the SQL request
SELECT SQL_CALC_FOUND_ROWS DISTINCT
            1 AS REALTIME,
            resources.resource_id,
            resources.name,
            resources.alias,
            resources.address,
            resources.id,
            resources.internal_id,
            resources.parent_id,
            resources.parent_name,
            parent_resource.status AS `parent_status`,
            parent_resource.alias AS `parent_alias`,
            parent_resource.status_ordered AS `parent_status_ordered`,
            parent_resource.address AS `parent_fqdn`,
            severities.id AS `severity_id`,
            severities.level AS `severity_level`,
            severities.name AS `severity_name`,
            severities.type AS `severity_type`,
            severities.icon_id AS `severity_icon_id`,
            resources.type,
            resources.status,
            resources.status_ordered,
            resources.status_confirmed,
            resources.in_downtime,
            resources.acknowledged,
            resources.passive_checks_enabled,
            resources.active_checks_enabled,
            resources.notifications_enabled,
            resources.last_check,
            resources.last_status_change,
            resources.check_attempts,
            resources.max_check_attempts,
            resources.notes,
            resources.notes_url,
            resources.action_url,
            resources.output,
            resources.poller_id,
            resources.has_graph,
            instances.name AS `monitoring_server_name`,
            resources.enabled,
            resources.icon_id,
            resources.severity_id
        FROM `centreon_storage`.`resources`
        LEFT JOIN `centreon_storage`.`resources` parent_resource
            ON parent_resource.id = resources.parent_id
            AND parent_resource.type = 1 LEFT JOIN `centreon_storage`.`severities`
            ON `severities`.severity_id = `resources`.severity_id
        LEFT JOIN `centreon_storage`.`resources_tags` AS rtags
            ON `rtags`.resource_id = `resources`.resource_id
        INNER JOIN `centreon_storage`.`instances`
            ON `instances`.instance_id = `resources`.poller_id WHERE ((CASE WHEN resources.type = 1 THEN resources.name ELSE resources.parent_name END REGEXP 'authorwin3-a' OR CASE WHEN resources.type = 1 THEN resources.alias ELSE parent_resource.alias END REGEXP 'authorwin3-a' OR parent_resource.address REGEXP 'authorwin3-a' OR resources.type IN (0,2) AND resources.name REGEXP 'authorwin3-a' OR resources.alias REGEXP 'authorwin3-a' OR parent_resource.alias REGEXP 'authorwin3-a' OR resources.address REGEXP 'authorwin3-a' OR resources.output REGEXP 'authorwin3-a')) AND  resources.name NOT LIKE '\_Module\_%'
            AND resources.parent_name NOT LIKE '\_Module\_BAM%'
            AND resources.enabled = 1 AND resources.type != 3 AND (EXISTS (
            SELECT 1
            FROM `centreon_storage`.centreon_acl acl
            WHERE
                resources.type = 1
                AND resources.id = acl.host_id
                AND acl.group_id IN (1)
        ) OR EXISTS (
            SELECT 1
            FROM `centreon_storage`.centreon_acl acl
            WHERE
                resources.type = 2
                AND resources.parent_id = acl.host_id
                AND resources.id = acl.service_id
                AND acl.group_id IN (1)
        ) OR EXISTS (
            SELECT 1
            FROM `centreon_storage`.centreon_acl acl
            WHERE
                resources.type = 0
                AND resources.parent_id = acl.host_id
                AND resources.id = acl.service_id
                AND acl.group_id IN (1)
        )) ORDER BY resources.last_status_change IS NULL, resources.last_status_change DESC LIMIT 0, 30


