



Needs Votes

Custom View - Add a "Change period" button on graph in Centreon Map widgets

Related products:Infra Monitoring - Custom Views
  • October 31, 2022
  • 2 replies
  • 29 views

sduret
Centreonian
Forum|alt.badge.img+13

Persona:
administrator and/or operator

Problem to solve:
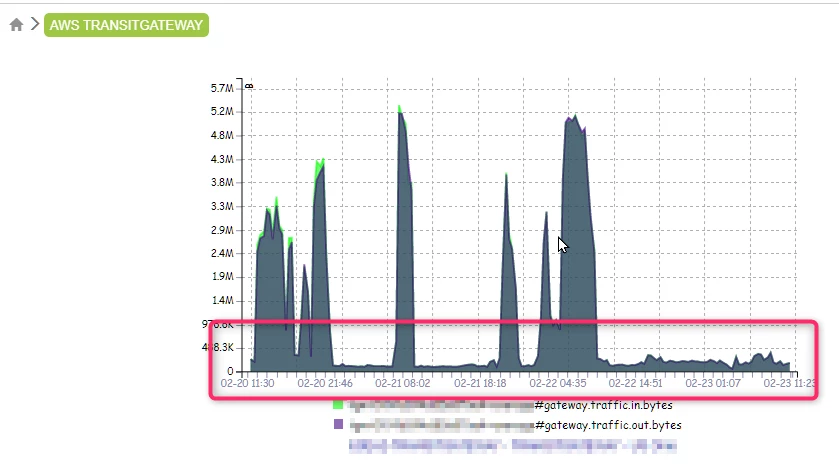
When we display a view in the Centreon Map widget, it’s not possible to change the period of the displayed graphs.
Expected outcome:
Make it easier to display a chart's history in a Map widget.

Potential solutions:
In the Map widget, add a period

  • either on the top of the graph
  • or on the top of the view (in order to apply it to all graphs)

2 replies

rchauvel
Centreonian
Forum|alt.badge.img+18
  • Centreonian
  • November 18, 2022
NewDiscussion ongoing

rchauvel
Centreonian
Forum|alt.badge.img+18
  • Centreonian
  • December 19, 2022
Discussion ongoingNeeds Votes