Solved

Host performance are useless ?

  • January 12, 2022
  • 6 replies
  • 84 views

sdouce
Forum|alt.badge.img+12

Is there any configuration to graph ping host performance data .

All my are populated with perfdatas ,

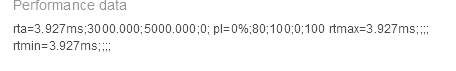
But i see no graph …

Any idea ?


Best answer by itoussies

Hello @sdouce ,

You won’t be able to see graph for host resources. If you want that kind of graph, you will have to deploy a “Ping” service.

6 replies

itoussies
Centreonian
Forum|alt.badge.img+11
  • Centreonian
  • Answer
  • January 12, 2022

Hello @sdouce ,

You won’t be able to see graph for host resources. If you want that kind of graph, you will have to deploy a “Ping” service.


rchauvel
Centreonian
Forum|alt.badge.img+18
  • Centreonian
  • January 13, 2022

Moved to Data Collection.


sdouce
Forum|alt.badge.img+12
  • Author
  • Builder **
  • January 13, 2022

Thank !:sob:


Forum|alt.badge.img+1
  • Steward *
  • December 2, 2025

Hello,

Sorry to dig up this topic… But we face the same issue,

  • performance datas generated by the host check are not generating graphs
  • if we create a ping service linked to the host model, we de facto create a “double ping” of the same host
  • so to avoid this double ping, we modify the “generic-active-host” template to “dummy-host” to avoid the ping at the host level
  • … but doing that, we brake the dependency system that is based on the hosts…

I don’t understand why host checks cannot create performance graphs… it seems to be more like an UI issue than a backend

Any idea?

Thanks


lpinsivy
Centreonian
Forum|alt.badge.img+21
  • Centreonian
  • December 2, 2025

HI ​@sdouce , ​@bitwatch3r 

Host monitoring is not performance-based but status-based.

Its purpose is to verify that the poller has access to the resource being monitored.

By default, the host status is calculated based on the service statuses. If at least one service is OK, then the host is UP.

The host monitoring command is only used to validate the status of a service that might be experiencing problems in order to determine the source of the issue.

Only service monitoring generates performance graphs.

For example:

default host check command:

$USER1$/check_icmp -H $HOSTADDRESS$ -w 3000.0,80% -c 5000.0,100% -p 1

default ping command:

$USER1$/check_icmp -H $HOSTADDRESS$ -n $_SERVICEPACKETNUMBER$ -w $_SERVICEWARNING$ -c $_SERVICECRITICAL$

PACKETNUMBER => 5
WARNING => 200,20%
CRITICAL => 400,50%

The host’s thresholds are bigger than for Ping service (3sec vs 200ms).


Forum|alt.badge.img+1
  • Steward *
  • December 2, 2025

@lpinsivy :

Thanks for the reply on this old post.

It’s a bit weird to have a double ping check, only to monitor if the service isn’t facing an issue.

Moreover, it requires additional resources to have 2x (e.g) pings, one for the graphs, and one for the “host status” triggering the dependancies.

Moreover, if we have different conditions on both pings, it implies to explain to all our colleagues to check the “service ping” and not the “host ping” because he might not be relevant, and has no graphs.


I didn’t find any way to define a service as “master for the host”, just like PRTG does, so that we could use this only ping service.

We tried a “workaround” with an “event handler” on the “ping service” if critical, to push this same state to the “dummy host”, but when the host is down, services are then “paused”, and so the ping is never retried to re-trigger the handler when it’s up again. Then we can’t use this solution.


Isn’t there a way to avoid this dual ping check ? Is it the sole solution ?


Best Regards,