Question

Dashboard Centreon metrics can't be read in widget type "Top/bottom" but can be in "Single metric"

  • May 23, 2024
  • 10 replies
  • 232 views

Forum|alt.badge.img+3

Hello, 

I’d like to use the Dashboard feature to see the remaining percentage of ink of multiple printers. 

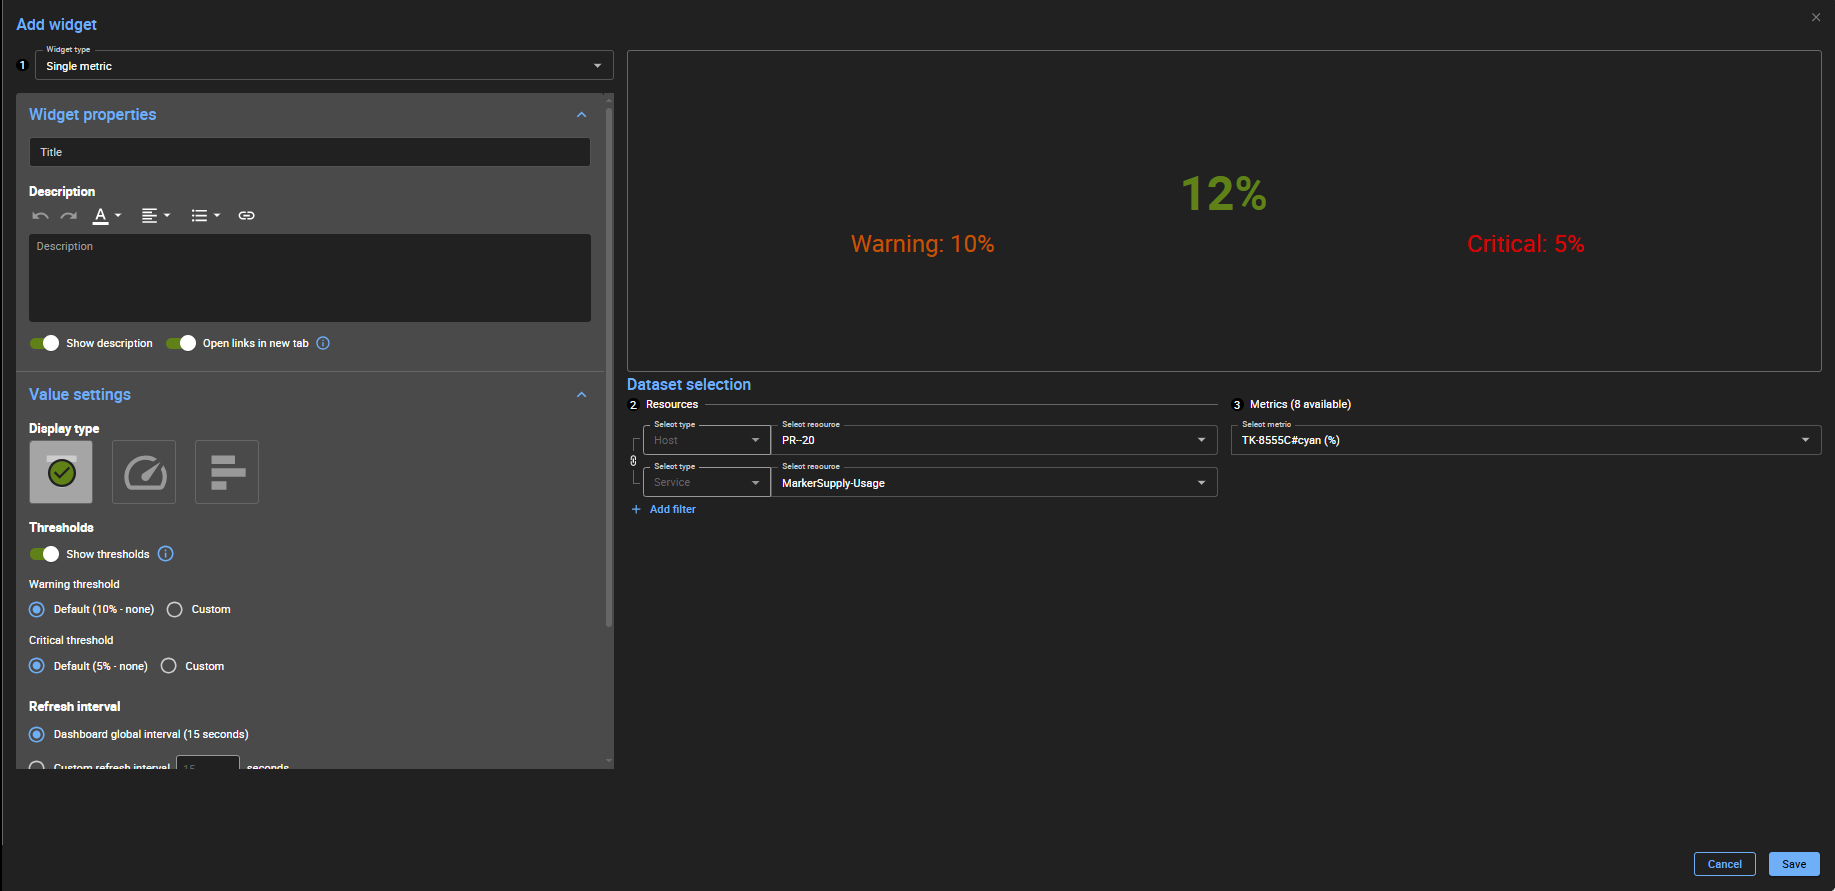
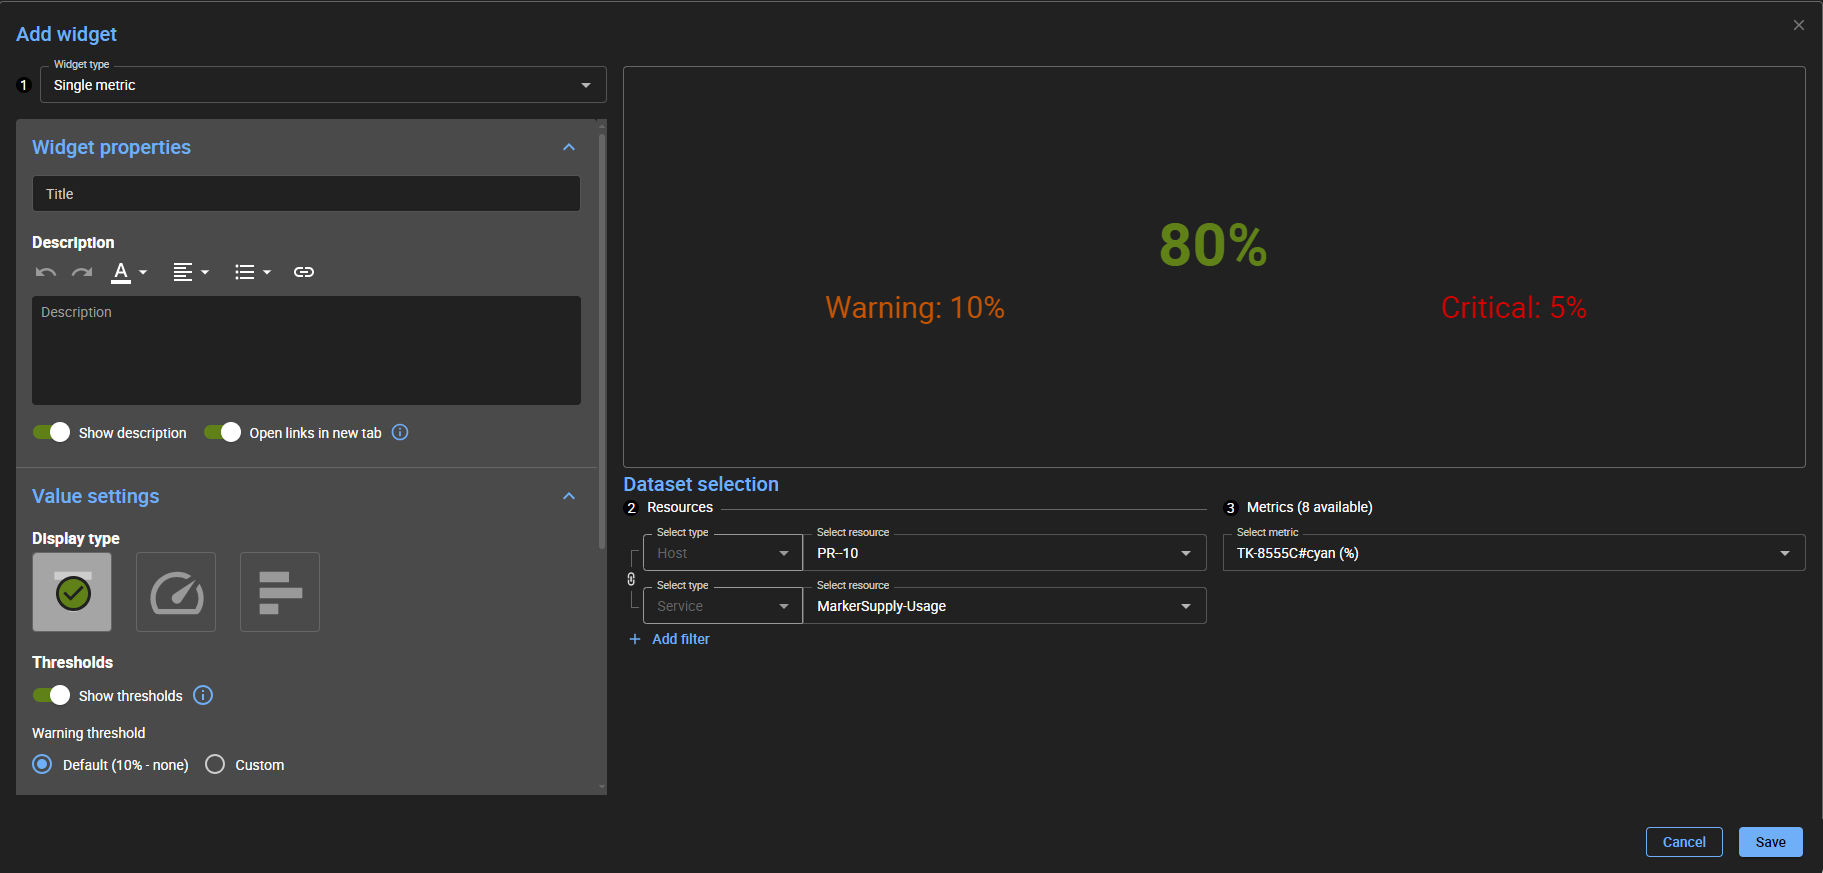
If I try to use the “Single metric” Widget it works as you can see bellow : 


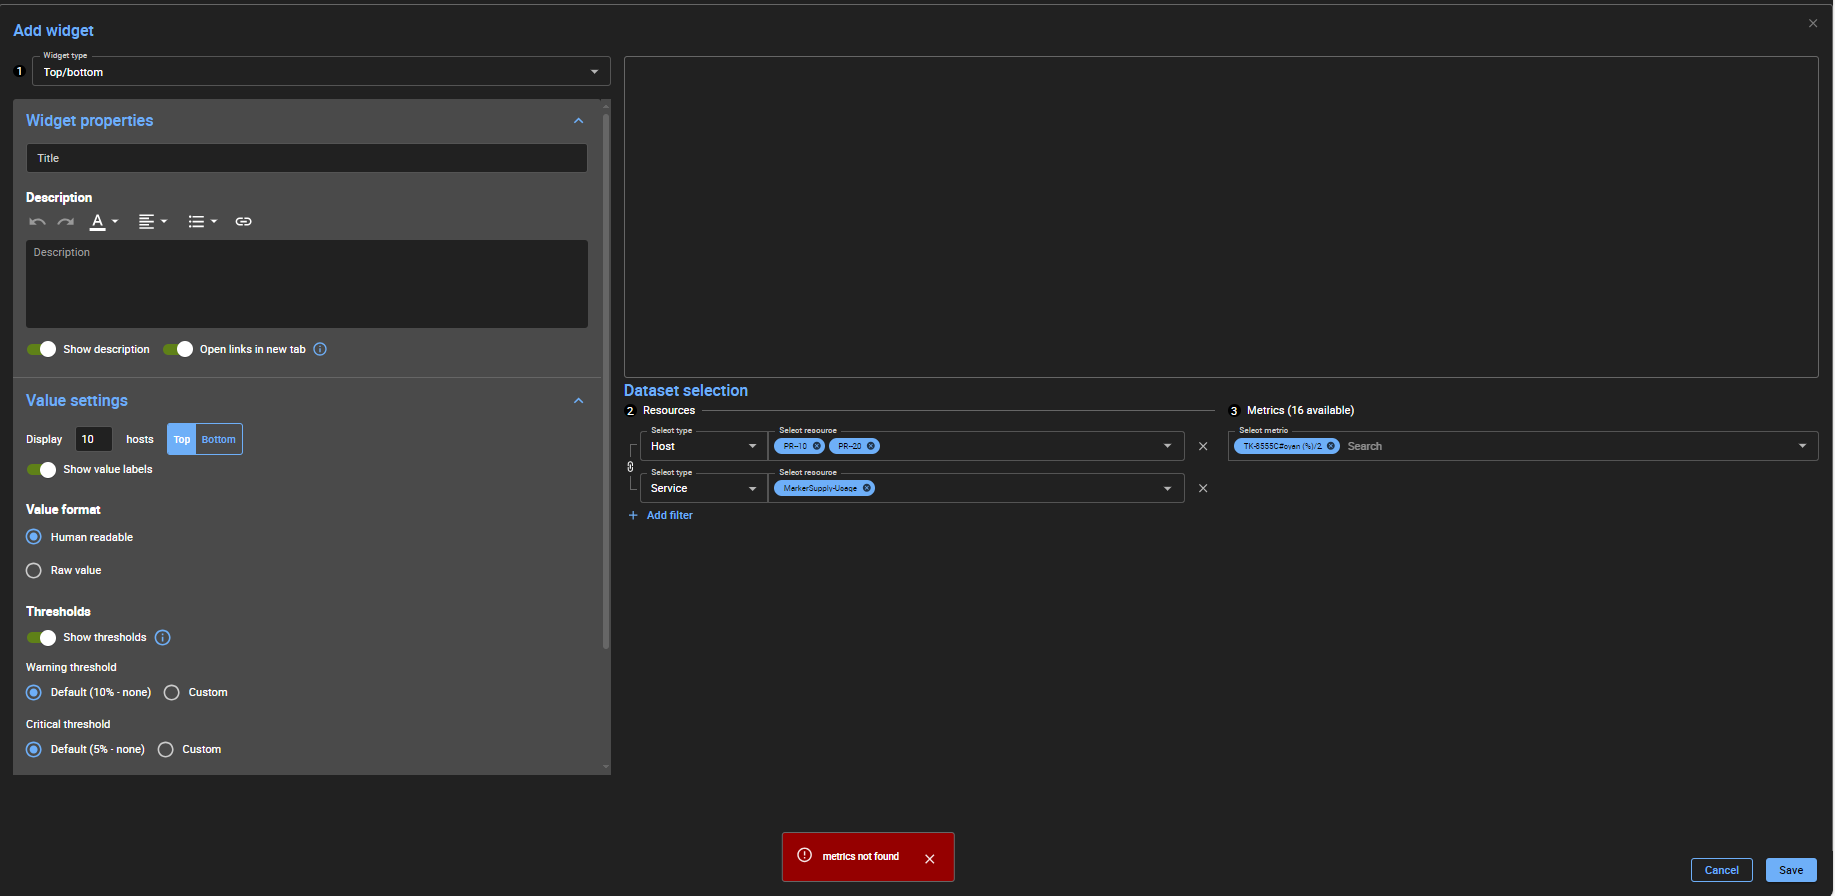
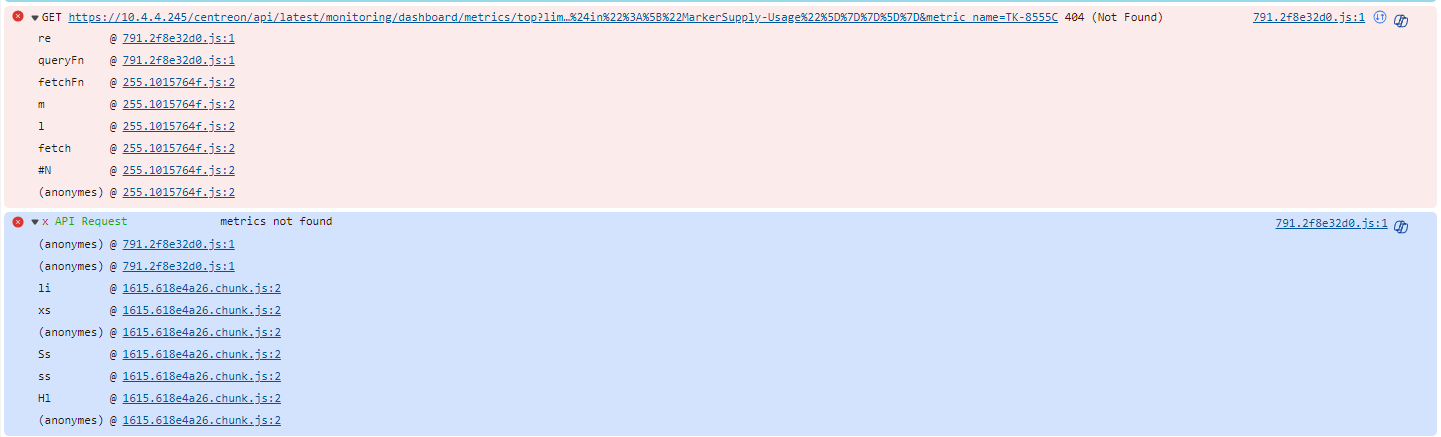
However when I put the same Datast selection in the “Top/bottom” Widget I have a “metrics not found” error : 


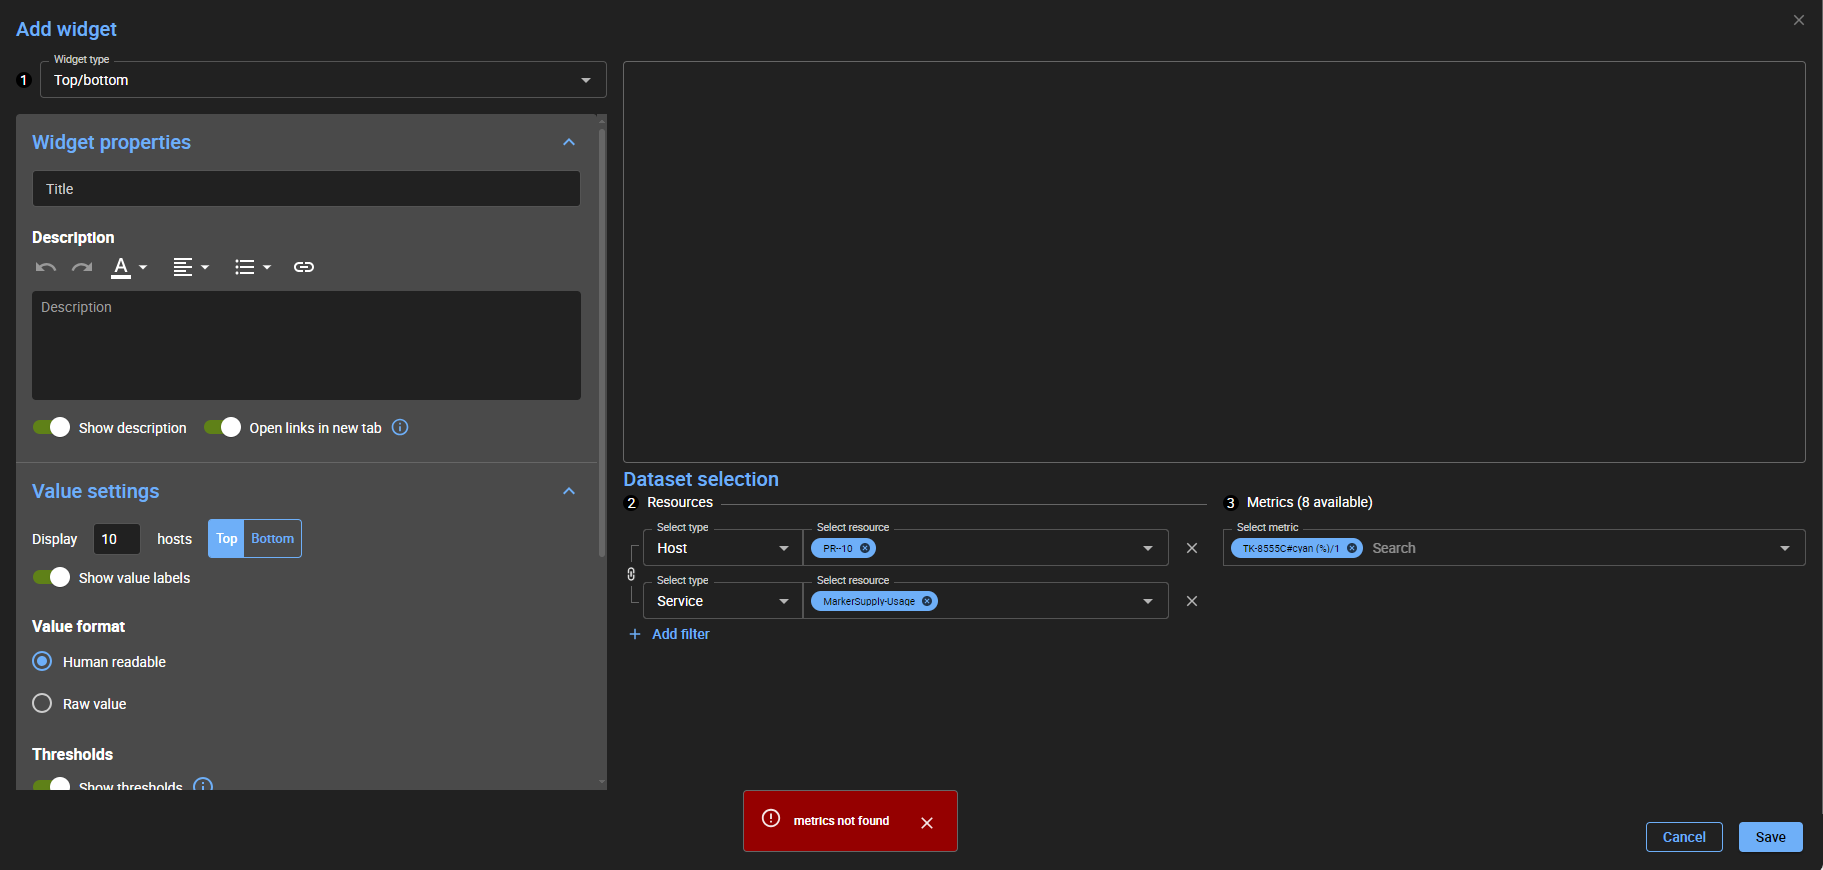
As said above, I would like to monitor multiple printers that way that’s why using the “Single metrics” widget on all printers plus all color (black, cyan, magenta, yellow) is not comfortable at all and would like to use 4 “Top/bottom” Widgets instead (one for each color). 

If you know a way to fix this issue, I request your assistance. 
If you need further information feel free to ask.

10 replies

rchauvel
Centreonian
Forum|alt.badge.img+18
  • Centreonian
  • May 23, 2024

The top/bottom widget is supposed to compare the same metric for multiple hosts/services. Have you tried adding another host that has the same metric?


I am thinking it could be an issue with the top/bottom widget mis-handling non-alphanumeric values. Let me check with the dev team.


Forum|alt.badge.img+3
  • Author
  • Steward *
  • May 23, 2024

The top/bottom widget is supposed to compare the same metric for multiple hosts/services. Have you tried adding another host that has the same metric?


I am thinking it could be an issue with the top/bottom widget mis-handling non-alphanumeric values. Let me check with the dev team.

I tried adding another host that has the same metric but the error still remains : 


The “PR--20” host also works just fine in Single metric :


Tom Darneix
Centreonian
Forum|alt.badge.img+5
  • Centreonian
  • May 23, 2024

Hello @TERPEZ , can you give me the URL that fails to check out if dynamic parameters are correctly parsed?


Forum|alt.badge.img+3
  • Author
  • Steward *
  • May 23, 2024

Hello @TERPEZ , can you give me the URL that fails to check out if dynamic parameters are correctly parsed?

Hello @Tom Darneix, Is this URL what you’re asking for ? Or are you asking for another one ? 


Forum|alt.badge.img+3
  • Author
  • Steward *
  • May 31, 2024

any update ?


Tom Darneix
Centreonian
Forum|alt.badge.img+5
  • Centreonian
  • May 31, 2024

Hello, can you open your browser's console, select the Network tab then filter out "performances/data". Select the request that fails then print us the full URL


Forum|alt.badge.img+3
  • Author
  • Steward *
  • May 31, 2024

Hello, can you open your browser's console, select the Network tab then filter out "performances/data". Select the request that fails then print us the full URL​​​​

Here : 
https://10.4.4.245/centreon/api/latest/monitoring/dashboard/metrics/top?limit=10&sort_by=%7B%22current_value%22%3A%22ASC%22%7D&search=%7B%22%24and%22%3A%5B%7B%22host.id%22%3A%7B%22%24in%22%3A%5B92%2C93%5D%7D%7D%2C%7B%22service.name%22%3A%7B%22%24in%22%3A%5B%22MarkerSupply-Usage%22%5D%7D%7D%5D%7D&metric_name=TK-8555C

Hope it gives you a hint of what’s wrong.


Forum|alt.badge.img+3
  • Author
  • Steward *
  • June 6, 2024

Was the URL helpfull ? 
Do you need me to provide further information ?


Tom Darneix
Centreonian
Forum|alt.badge.img+5
  • Centreonian
  • June 6, 2024

Thanks @TERPEZ , we will investigate on this. I hope the dash in the metric name is not the issue.