Question

[DASHBOARD] --- Single Metrics values displays 0 (Centreon 24.04

  • December 5, 2024
  • 2 replies
  • 76 views

Forum|alt.badge.img+6

Hello The Watch,

I have a WSUS Dashboard that is supposed to show me various single metrics reported by NSClient++
Below, we can see that the host's service values are correctly taken into account by the poller.

OK: Computers Up-to-date: 242, Needing Updates: 12, With Update Errors: 0, Not Contacted: 261, Unassigned: 1 | 'computers_up_to_date'=242;;;0; 'computers_needing_updates'=12;;;0; 'computers_with_update_errors'=0;;;0; 'computers_not_contacted'=261;;;0; 'computers_unassigned'=1;;;0;

But when I create the Dashboard

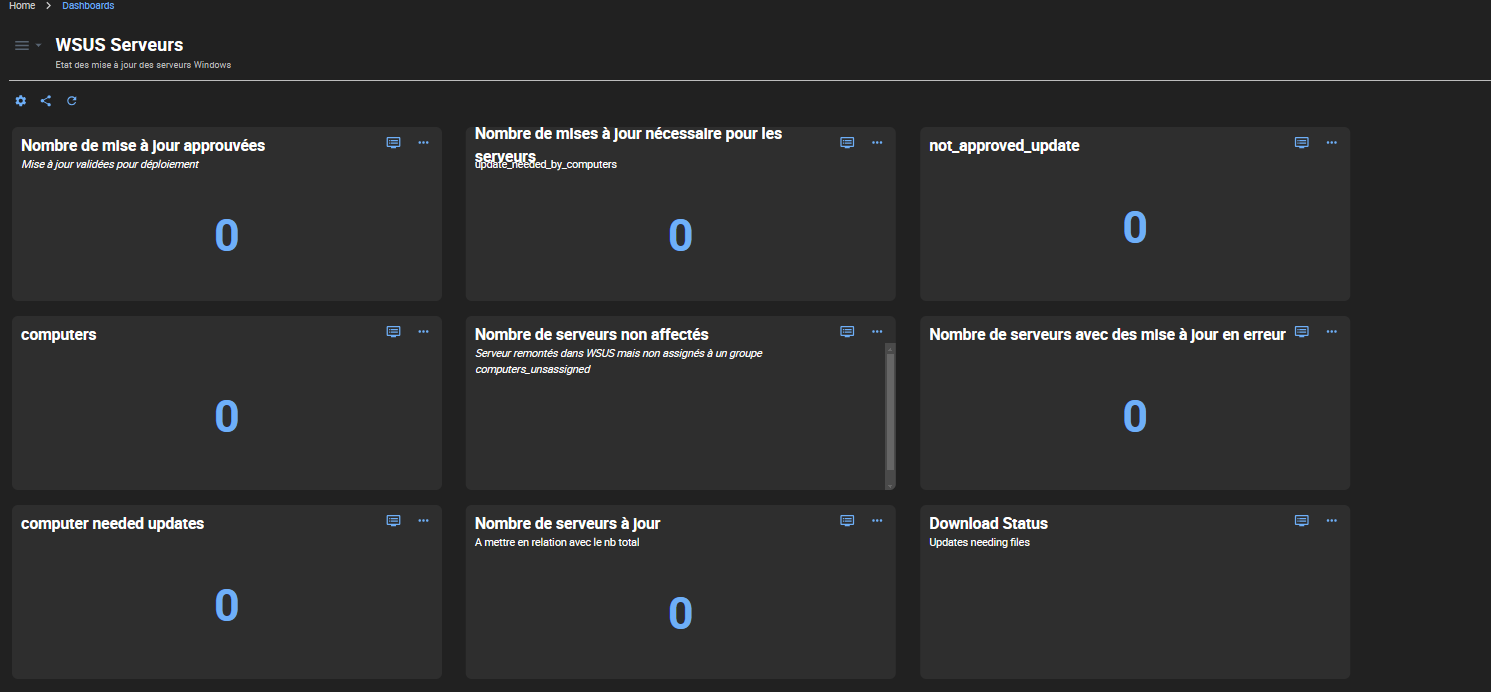
All values are zero!

An open case on the support side.


Thanks for your help.

Best regards,

Vincent (Nantes Métropole)

2 replies

Forum|alt.badge.img+6
  • Author
  • Steward **
  • December 6, 2024

Hello,
As a test, I deleted and recreated a new Dashboard and, in comparison, created a view based on the same model. Here's the result:

?name=mceclip0.png


?name=mceclip1.png

Strangely, on the dashboard, the graph shows the metrics... Why, then, is this not the case on the single metrics?

Best Regards,

Vincent LIARD


Forum|alt.badge.img+6
  • Author
  • Steward **
  • January 8, 2025

Hello,
Still no news about this issue !

Thx