Question

Engine statistics perf graphs missing

  • December 16, 2025
  • 6 replies
  • 48 views

Forum|alt.badge.img+2

Hello everyone,

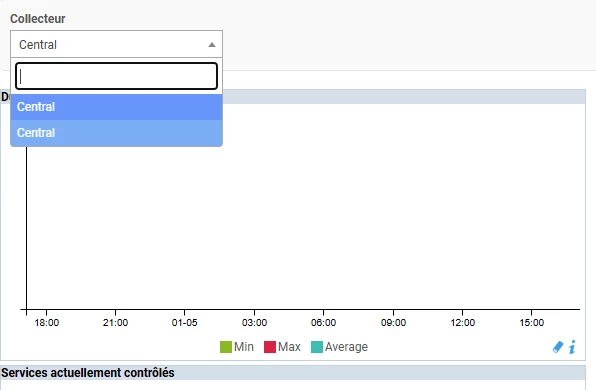
Since migration (22.10 to 25.10) Graphs are no longer generated on Administration  >  Platform Status  > Engine Statistics.

I’ve checked

  • permissions:  /var/lib/centreon/nagios-perf/perfmon-1 : -rw-r--r-- 1 centreon-gorgone centreon-gorgone
  • files : .rrd files are present, but don’t move since migration date
  • /usr/sbin/centenginestats -c /etc/centreon-engine/centengine.cfg give stats
  • no error in logs

Where is the problem ?


6 replies

lpinsivy
Centreonian
Forum|alt.badge.img+21
  • Centreonian
  • January 5, 2026

Hi ​@punxy, can you check in /etc/centreon-gorgone/config.d/40-gorgoned.yaml file that statistics is enabled?

Rights should be:

# ls -lah /var/lib/centreon/nagios-perf/perfmon-1
total 49M
drwxr-xr-x 2 centreon-gorgone centreon-gorgone 4.0K Jul 29 2024 .
drwxrwxr-x 3 centreon centreon 23 Nov 6 16:34 ..
-rw-r--r-- 1 centreon-gorgone centreon-gorgone 4.9M Jan 5 10:35 nagios_active_host_execution.rrd
-rw-r--r-- 1 centreon-gorgone centreon-gorgone 6.5M Jan 5 10:35 nagios_active_host_last.rrd
-rw-r--r-- 1 centreon-gorgone centreon-gorgone 4.9M Jan 5 10:35 nagios_active_host_latency.rrd
-rw-r--r-- 1 centreon-gorgone centreon-gorgone 4.9M Jan 5 10:35 nagios_active_service_execution.rrd
-rw-r--r-- 1 centreon-gorgone centreon-gorgone 6.5M Jan 5 10:35 nagios_active_service_last.rrd
-rw-r--r-- 1 centreon-gorgone centreon-gorgone 4.9M Jan 5 10:35 nagios_active_service_latency.rrd
-rw-r--r-- 1 centreon-gorgone centreon-gorgone 4.9M Jan 5 10:35 nagios_cmd_buffer.rrd
-rw-r--r-- 1 centreon-gorgone centreon-gorgone 4.9M Jan 5 10:35 nagios_hosts_states.rrd
-rw-r--r-- 1 centreon-gorgone centreon-gorgone 6.5M Jan 5 10:35 nagios_services_states.rrd


Forum|alt.badge.img+2
  • Author
  • Steward *
  • January 5, 2026

Hi,

Stats are enabled, I compared with a fresh installation from VM provided by Centreon.

- name: engine
      package: "gorgone::modules::centreon::engine::hooks"
      enable: true
      command_file: "/var/lib/centreon-engine/rw/centengine.cmd"

    - name: statistics
      package: "gorgone::modules::centreon::statistics::hooks"
      enable: true
      broker_cache_dir: "/var/cache/centreon//broker-stats/"
      cron:
        - id: broker_stats
          timespec: "*/5 * * * *"
          action: BROKERSTATS
          parameters:
            timeout: 10
        - id: engine_stats
          timespec: "*/5 * * * *"
          action: ENGINESTATS
          parameters:
            timeout: 10


Rights (2 is ok with my config) 9 december is the day of migration :

ls -lah /var/lib/centreon/nagios-perf/perfmon-2/
total 24M
drwxr-xr-x 2 centreon-gorgone centreon-gorgone 4.0K Jul 28 2014 .
drwxrwxr-x 3 centreon centreon 23 Dec 19 13:21 ..
-rw-r--r-- 1 centreon-gorgone centreon-gorgone 2.4M Dec 9 19:00 nagios_active_host_execution.rrd
-rw-r--r-- 1 centreon-gorgone centreon-gorgone 3.2M Dec 9 19:00 nagios_active_host_last.rrd
-rw-r--r-- 1 centreon-gorgone centreon-gorgone 2.4M Dec 9 19:00 nagios_active_host_latency.rrd
-rw-r--r-- 1 centreon-gorgone centreon-gorgone 2.4M Dec 9 19:00 nagios_active_service_execution.rrd
-rw-r--r-- 1 centreon-gorgone centreon-gorgone 3.2M Dec 9 19:00 nagios_active_service_last.rrd
-rw-r--r-- 1 centreon-gorgone centreon-gorgone 2.4M Dec 9 19:00 nagios_active_service_latency.rrd
-rw-r--r-- 1 centreon-gorgone centreon-gorgone 2.4M Dec 9 19:00 nagios_cmd_buffer.rrd
-rw-r--r-- 1 centreon-gorgone centreon-gorgone 2.4M Dec 9 19:00 nagios_hosts_states.rrd
-rw-r--r-- 1 centreon-gorgone centreon-gorgone 3.2M Dec 9 19:00 nagios_services_states.rrd


lpinsivy
Centreonian
Forum|alt.badge.img+21
  • Centreonian
  • January 5, 2026

Can you enable gorgoned debug through /etc/sysconfig/gorgoned file and restart gorgoned process.

Then check in /var/log/centreon-gorgone/gorgoned.log file if you have errors.


Forum|alt.badge.img+2
  • Author
  • Steward *
  • January 5, 2026

No error but I think unknown target is anormal

2026-01-05 17:00:06 - DEBUG - [core] Message received internal - [GETLOG] [] [2] {}
2026-01-05 17:00:06 - DEBUG - [proxy] unknown target '2'

On Web gui poller show 2 Central, both empty.


2026-01-05 17:00:06 - INFO - [cron] Launching job 'engine_stats'
2026-01-05 17:00:06 - DEBUG - [cron] internal message: [ENGINESTATS] [] [] {"content":{"timeout":"10"}}
2026-01-05 17:00:06 - DEBUG - [core] Message received internal - [ENGINESTATS] [] [] {"content":{"timeout":"10"}}
2026-01-05 17:00:06 - DEBUG - [statistics] Event: [ENGINESTATS] [6bbd5a56e5c76345e14c23a765f976f581978a45ac6b38fcc277e6611dd7894440aadc39a1de65cea874c8fc2c3bebf11024b278dca7d47135a44f7242bc0926] [] {"content":{"timeout":"10"}}
2026-01-05 17:00:06 - DEBUG - [cron] Event: [ACK] [6bbd5a56e5c76345e14c23a765f976f581978a45ac6b38fcc277e6611dd7894440aadc39a1de65cea874c8fc2c3bebf11024b278dca7d47135a44f7242bc0926] {"data":null,"code":0}
2026-01-05 17:00:06 - DEBUG - [statistics] internal message: [PUTLOG] [6bbd5a56e5c76345e14c23a765f976f581978a45ac6b38fcc277e6611dd7894440aadc39a1de65cea874c8fc2c3bebf11024b278dca7d47135a44f7242bc0926] [] {"etime":1767628806,"token":"6bbd5a56e5c76345e14c23a765f976f581978a45ac6b38fcc277e6611dd7894440aadc39a1de65cea874c8fc2c3bebf11024b278dca7d47135a44f7242bc0926","code":0,"instant":1,"data":{"message":"action enginestats starting"}}
2026-01-05 17:00:06 - DEBUG - [core] Message received internal - [PUTLOG] [6bbd5a56e5c76345e14c23a765f976f581978a45ac6b38fcc277e6611dd7894440aadc39a1de65cea874c8fc2c3bebf11024b278dca7d47135a44f7242bc0926] [] {"etime":1767628806,"token":"6bbd5a56e5c76345e14c23a765f976f581978a45ac6b38fcc277e6611dd7894440aadc39a1de65cea874c8fc2c3bebf11024b278dca7d47135a44f7242bc0926","code":0,"instant":1,"data":{"message":"action enginestats starting"}}
2026-01-05 17:00:06 - INFO - [statistics] Collecting Engine statistics from target '2'
2026-01-05 17:00:06 - DEBUG - [statistics] internal message: [ADDLISTENER] [] [] [{"log_pace":3,"target":"2","identity":"gorgonestatistics","event":"STATISTICSLISTENER","timeout":18,"token":"6bbd5a56e5c76345e14c23a765f976f581978a45ac6b38fcc277e6611dd7894440aadc39a1de65cea874c8fc2c3bebf11024b278dca7d47135a44f7242bc0926-2"}]
2026-01-05 17:00:06 - DEBUG - [statistics] internal message: [COMMAND] [6bbd5a56e5c76345e14c23a765f976f581978a45ac6b38fcc277e6611dd7894440aadc39a1de65cea874c8fc2c3bebf11024b278dca7d47135a44f7242bc0926-2] [2] {"content":[{"timeout":"10","command":"/usr/sbin/centenginestats -c /etc/centreon-engine//centengine.cfg","metadata":{"source":"enginestats","poller_id":"2"}}],"instant":1}
2026-01-05 17:00:06 - DEBUG - [statistics] internal message: [PUTLOG] [6bbd5a56e5c76345e14c23a765f976f581978a45ac6b38fcc277e6611dd7894440aadc39a1de65cea874c8fc2c3bebf11024b278dca7d47135a44f7242bc0926] [] {"data":{"message":"action enginestats finished"},"etime":1767628806,"instant":1,"code":2,"token":"6bbd5a56e5c76345e14c23a765f976f581978a45ac6b38fcc277e6611dd7894440aadc39a1de65cea874c8fc2c3bebf11024b278dca7d47135a44f7242bc0926"}
2026-01-05 17:00:06 - DEBUG - [core] Message received internal - [ADDLISTENER] [] [] [{"log_pace":3,"target":"2","identity":"gorgonestatistics","event":"STATISTICSLISTENER","timeout":18,"token":"6bbd5a56e5c76345e14c23a765f976f581978a45ac6b38fcc277e6611dd7894440aadc39a1de65cea874c8fc2c3bebf11024b278dca7d47135a44f7242bc0926-2"}]
2026-01-05 17:00:06 - DEBUG - [statistics] Event: [ACK] [6bbd5a56e5c76345e14c23a765f976f581978a45ac6b38fcc277e6611dd7894440aadc39a1de65cea874c8fc2c3bebf11024b278dca7d47135a44f7242bc0926] {"data":{"message":"message inserted"},"code":0}
2026-01-05 17:00:06 - DEBUG - [listener] add token '6bbd5a56e5c76345e14c23a765f976f581978a45ac6b38fcc277e6611dd7894440aadc39a1de65cea874c8fc2c3bebf11024b278dca7d47135a44f7242bc0926-2'
2026-01-05 17:00:06 - DEBUG - [core] Message received internal - [GETLOG] [] [2] {}
2026-01-05 17:00:06 - DEBUG - [proxy] unknown target '2'
2026-01-05 17:00:06 - DEBUG - [core] Message received internal - [COMMAND] [6bbd5a56e5c76345e14c23a765f976f581978a45ac6b38fcc277e6611dd7894440aadc39a1de65cea874c8fc2c3bebf11024b278dca7d47135a44f7242bc0926-2] [2] {"content":[{"timeout":"10","command":"/usr/sbin/centenginestats -c /etc/centreon-engine//centengine.cfg","metadata":{"source":"enginestats","poller_id":"2"}}],"instant":1}
2026-01-05 17:00:06 - DEBUG - [statistics] Event: [ACK] [754d107f65d50cc73be593bb3ef3c302b2c0122624e2aa41485e6bf52c91f19182ceef139cc7843d4da5caa2c6d1d3f8ad64b1b032c15749daaafe384f9d3444] {"code":2,"data":{"data":[{"token":"6bbd5a56e5c76345e14c23a765f976f581978a45ac6b38fcc277e6611dd7894440aadc39a1de65cea874c8fc2c3bebf11024b278dca7d47135a44f7242bc0926-2","event":"STATISTICSLISTENER","timeout":18,"identity":"gorgonestatistics","target":"2","log_pace":3}],"action":"addlistener","message":"ok"}}
2026-01-05 17:00:06 - DEBUG - [proxy] unknown target '2'
2026-01-05 17:00:06 - DEBUG - [listener] trigger event '6bbd5a56e5c76345e14c23a765f976f581978a45ac6b38fcc277e6611dd7894440aadc39a1de65cea874c8fc2c3bebf11024b278dca7d47135a44f7242bc0926-2'


Forum|alt.badge.img+3
  • Steward *
  • February 10, 2026

Bonjour,
J’ai exactement le même souci pour les graph, sauf que j’ai bien mon central et mon collecteur d’affichés (et non deux fois central).
Cdlt


Forum|alt.badge.img
  • Steward *
  • February 16, 2026

Hello, 

I had similar issue, statistics were enable, rrd generated and permissions ok but not display

Console throw this :

moment-timezone-with-data.min.js:1 Uncaught Error: Time zone name must be a string, got 1771151570000 [number]
at L.tz (moment-timezone-with-data.min.js:1:6292)
at CentreonGraph.getTimes (centreon-graph.js:535:26)
at new CentreonGraph (centreon-graph.js:61:18)
at HTMLDivElement.<anonymous> (centreon-graph.js:836:19)
at ce.each (jquery.min.js:2:3129)
at ce.fn.init.each (jquery.min.js:2:1594)
at $.fn.centreonGraph (centreon-graph.js:829:21)
at main.get.php?p=50502:295:22 fixed it with ai (lumo)


I am not a js dev but I fixed it by modifying the getTimes function in  /usr/share/centreon/www/include/views/graphs/javascript/centreon-graph.js with AI (lumo)
 

getTimes: function () {
var start, end;

// --------------------------------------------------------------
// Case 1 – No explicit period selected (use the current period)
// --------------------------------------------------------------
if (this.settings.period.startTime === null ||
this.settings.period.endTime === null) {

// Ensure we have a proper zone name; default to UTC otherwise
var tzName = (typeof this.timezone === 'string')
? this.timezone
: 'UTC';

start = moment().tz(tzName);
end = moment().tz(tzName);

// Move the start back by the configured interval (e.g. 1 hour)
start.subtract(this.interval.number, this.interval.unit);

// --------------------------------------------------------------
// Case 2 – User supplied a specific start/end period
// --------------------------------------------------------------
} else {
var myStart = this.settings.period.startTime;
var myEnd = this.settings.period.endTime;

// Convert seconds (API) to milliseconds if necessary
if (typeof myStart === "number") {
myStart = myStart * 1000;
}
if (typeof myEnd === "number") {
myEnd = myEnd * 1000;
}

// Determine which time‑zone to apply
var tzName = (typeof this.timezone === 'string')
? this.timezone
: moment.tz.guess(); // smart fallback

// Build Moment objects from the timestamps, then apply the zone
start = moment(myStart).tz(tzName);
end = moment(myEnd).tz(tzName);
}

return {
start: start.unix(), // timestamps in seconds
end: end.unix()
};
},


Working fine now if this can help