Hello everyone. I don’t know if what i want to do is in fact really hard, if i’m taking it by the wrong end, or if i’m simply missing something.
I have a service that execute a shell script on my remote host. This script lists the 50 biggest cpu activ process and returns the users associated with it and how much cpu percentage each of them uses.
When i look at the service graph i get kind of what i want, some curves representing each of these values.
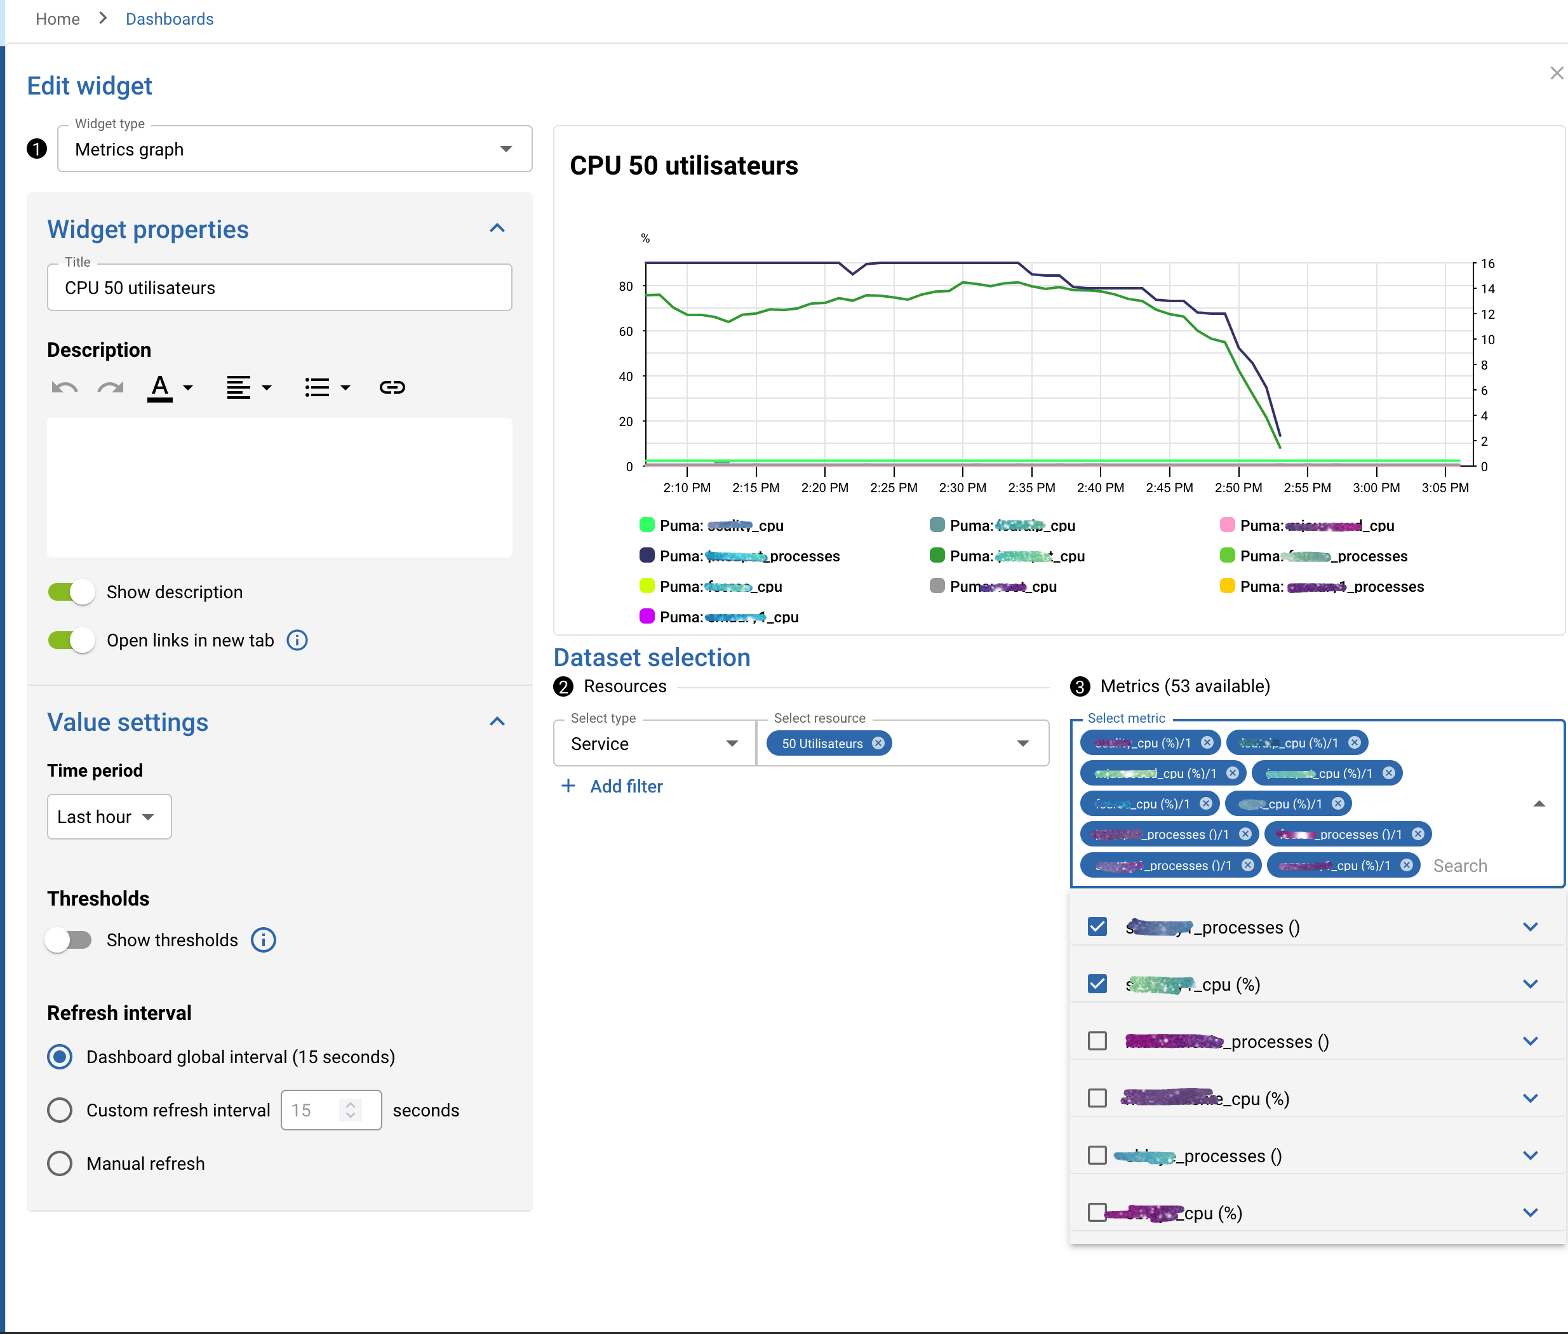
But when i want to add this supervision to my dashbord things become problematics. First i want to separate the two values that the service returns (numbers of active process and cpu utilization percentage) but this ultimately is not problematic as i can create a second service and divide the value between them.
But when i want to add a widget to either my dashboard or customview. There are no widget that offer to monitor all of the metrics given by a service, i have to manually check the metrics i want included.
The problem is that these metrics are dynamic, sometimes only 3 users will be represented, sometimes 20, so if i check at one point that i want the 10 metrics that are available at the moment, as soon as a new user start a process, it will not be represented.
I try to use regex in the metric selection, or seeing what i can do with filter but it doesn’t seem to be working.
Can you think of something that i’m either doing wrong or should be doing?
Sorry if by my lack of knowledge im asking a dumb question.
Thank you to everyone that took the time to read all of this.
Have a nice day
Noam Monmarché

Question
Graph widget with dynamic metrics
 +2
+2
Login to the community
No account yet? Create an account
Enter your E-mail address. We'll send you an e-mail with instructions to reset your password.