

We are excited to introduce the CIM MCP Server, an open-source project that brings the power of AI assistants directly to your Centreon Infra Monitoring (CIM) platform.
Available on GitHub, this integration opens a new way to interact with your monitoring data — using plain, natural language.
What Is MCP?
Model Context Protocol (MCP) is an open standard that allows AI assistants — such as ChatGPT, Claude, or Mistral Le Chat — to connect to external tools and services in a structured, secure way. By exposing capabilities through an MCP server, any compatible AI assistant can discover and invoke those capabilities on your behalf, turning your conversational prompts into real actions on your infrastructure.
Centreon MCP Server in a Nutshell
The CIM MCP Server acts as a bridge between your favorite AI assistant and your CIM instance. It is built in Python using the FastMCP library and communicates with the Centreon REST API using a token-based authentication model (Application Token).
Key highlights:
- Open source — Apache 2.0 licensed, available on GitHub
- Compatible with all supported Centreon versions & editions — whether you are running Centreon Open Source, IT Edition, Business Edition, or MSP Edition
- Works on all platforms — both on-premises and Centreon Cloud deployments are supported
- AI-agnostic — integrates with ChatGPT, Mistral Le Chat, Claude Code, and any other MCP-compatible client
Features
The MCP server currently exposes 22 tools organized across six functional areas.
Resource Monitoring
- list_resources is the central tool for querying your real-time monitoring data. It supports rich filtering across multiple dimensions simultaneously:
- By resource type: filter on hosts only, services only, or both
- By status: filter on OK, WARNING, CRITICAL, UNKNOWN, or PENDING states
- By status type: distinguish between HARD and SOFT states
- By name, alias, or parent name: substring matching on resource identifiers
- By output/information content: find resources whose check output contains (or does not contain) a given string — ideal for surfacing specific error messages across your infrastructure
- By scope: filter by host group, service group, host category, service category, or monitoring server (poller)
- Pagination and sorting: results are paginated and sortable by host name, alias, address, or state
This combination of filters makes it possible to ask highly specific questions such as "Show me all CRITICAL services on hosts in the 'production' host group whose output mentions 'disk full'" and get precise, actionable results directly in the conversation.
Two dedicated counting tools provide a fast status summary without retrieving individual resources:
- count_hosts_by_status — returns the total number of hosts in each state (UP, DOWN, UNREACHABLE, PENDING), optionally scoped to one or more host groups or host categories
- count_services_by_status — returns the total number of services in each state (OK, WARNING, CRITICAL, UNKNOWN, PENDING), optionally scoped by host name, host group, host category, service group, or service category
Both tools accept multiple filter sets combined with OR logic, making it straightforward to answer questions like "How many hosts are DOWN across the 'production' and 'staging' groups?" in a single call.
A dedicated tool lets the assistant inspect what happened on a single resource:
- get_host_timeline / get_service_timeline: fetch the event history of one host or service in real-time monitoring (state changes, notifications, downtimes, acknowledgements, comments). Filterable by event type, content substring and date range. Sorted by date descending by default. Useful to answer "what happened on this resource recently ?" without leaving the conversation.
A dedicated tool lets the assistant refresh state on demand:
- request_check — Trigger a check on one or more resources (hosts and services) without waiting for the next polling cycle. Useful right after a remediation action to confirm recovery in conversation. The
is_forcedflag (defaulttrue) controls whether the configured check interval is bypassed.
Infrastructure Inventory
Three read-only tools allow AI assistants to explore your monitoring topology:
- list_hostgroups — List host groups, filterable by host name, alias, address, state, poller, or group ID
- list_servicegroups — List service groups, filterable by host, service, host group, or poller attributes
- list_monitoring_servers — List pollers, with the ability to filter by name, ID, or running status
These tools serve as natural building blocks: an AI assistant can look up the relevant groups and pollers first, then use those identifiers to scope its subsequent queries precisely.
Two additional tools manage the configuration lifecycle of monitoring servers (pollers):
- generate_monitoring_servers_configurations — Generate the configuration files for one or more pollers by their IDs. If no IDs are provided, generates configurations for all pollers. Runs concurrently when multiple IDs are given.
- reload_monitoring_servers_configurations — Reload the configuration of one or more pollers by their IDs, pushing the generated files to the monitoring engines. If no IDs are provided, reloads all pollers. Runs concurrently when multiple IDs are given.
Poller configurations can be listed using list_configurations with model_type set to monitoring_server.
These tools are typically chained: after modifying host or service configurations, an AI assistant can generate then reload the affected pollers to apply changes without leaving the conversation.
Configuration
Four generic tools cover the full configuration lifecycle for hosts, host groups, host categories, host severities, host templates, and commands. Each tool accepts a model_type parameter to select the entity to operate on.
- list_configurations — List configurations, filterable by entity-specific fields (ID, name, alias, address, activation status, etc.). Results are paginated and sortable. Supported entity types:
command,host,host_category,host_group,host_severity,host_template,monitoring_server. - create_configuration — Create a new configuration by providing the required and optional parameters for the chosen entity type. Supported entity types:
command,host,host_category,host_group,host_severity,host_template. - update_configuration — Partially update an existing configuration by ID, using only the fields that need to change. Supported entity types:
host,host_category,host_group,host_severity,host_template. - delete_configurations — Delete one or more configurations by their IDs. Supported entity types:
host,host_category,host_group,host_severity,host_template.
Each entity type carries its own set of parameters passed alongside model_type. For example, creating a host requires specifying the monitoring server, name, and IP address, and accepts optional parameters such as SNMP community and version, geographic coordinates, severity, check and event handler commands, notification options, flap detection thresholds, and host group/category/template associations.
Acknowledgements
Acknowledge alerts without ever leaving your conversation:
- list_acknowledgements — List current acknowledgements, with pagination and sorting (by ID, host, start time, entry time, etc.)
- add_acknowledgements — Acknowledge one or more resources at once, applying a message and configuring options such as sticky acknowledgement and notifications
- cancel_acknowledgements — Remove acknowledgements from one or more resources, with the option to also cancel service acknowledgements when a host is unacknowledged
Downtimes
Full downtime lifecycle management through conversation:
- list_downtimes — Query scheduled or active downtimes, filterable by host name, alias, address, state, poller, and downtime properties (fixed, cancelled)
- set_downtimes — Schedule a downtime on one or more hosts or services, specifying start and end times, a comment, and whether the downtime is fixed or flexible
- cancel_downtimes — Cancel one or more downtimes by their IDs
Comments
- add_comments — Attach a comment to any host or service in real-time monitoring, useful for leaving context notes on an ongoing incident directly from the AI assistant
Metrics
- get_service_metrics — Retrieve all metrics of a service with their current values, units, and warning/critical thresholds. Useful for answering questions like "what is the current CPU usage?" or "how close is disk usage to the critical threshold?" without leaving the conversation.
Supported AI Assistants
The server exposes a standard HTTP/MCP endpoint, making it compatible with any MCP-capable client. The repository provides step-by-step integration guides for:
- Claude Code
- ChatGPT
- Mistral Le Chat
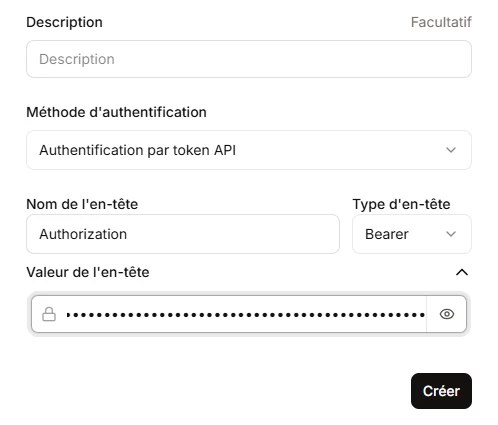
Any other MCP-compatible assistant can connect in the same way by pointing to the server URL and providing the Centreon API token in the centreon-api-token header.
Deployment
The server is designed to be easy to run, with two supported deployment options.
- Using uv (recommended for local use)
- Using Docker (recommended for production)
We welcome contributions, bug reports, and feature requests directly on GitHub. This is just the beginning — the MCP server is designed to grow with your needs and the evolving capabilities of AI assistants.
Feel free to share your needs and use cases.