


Question

Display bug in the status grid widget dashboard?

  • Sep 20, 2024 1:56 PM UTC
  • 9 replies
  • 204 views

Forum|alt.badge.img+17

Hello

I’m trying to make dashboard filtered on a host group (or a host category)

I want the “condensed”  view of the status grid widget

the host group has only 2 members.


‘Standard’ (non condensed) I have my 2 hosts
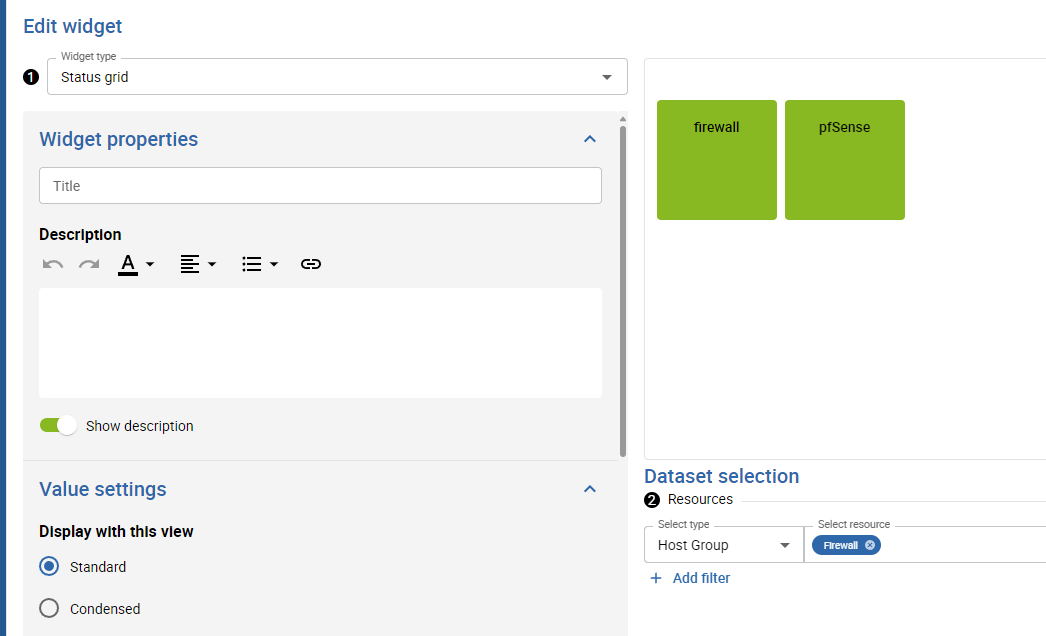
 

if I use Condensed , the total in the tile is wrong and is counting ALL the host without filtering. it should display 2 in green, it says 6...
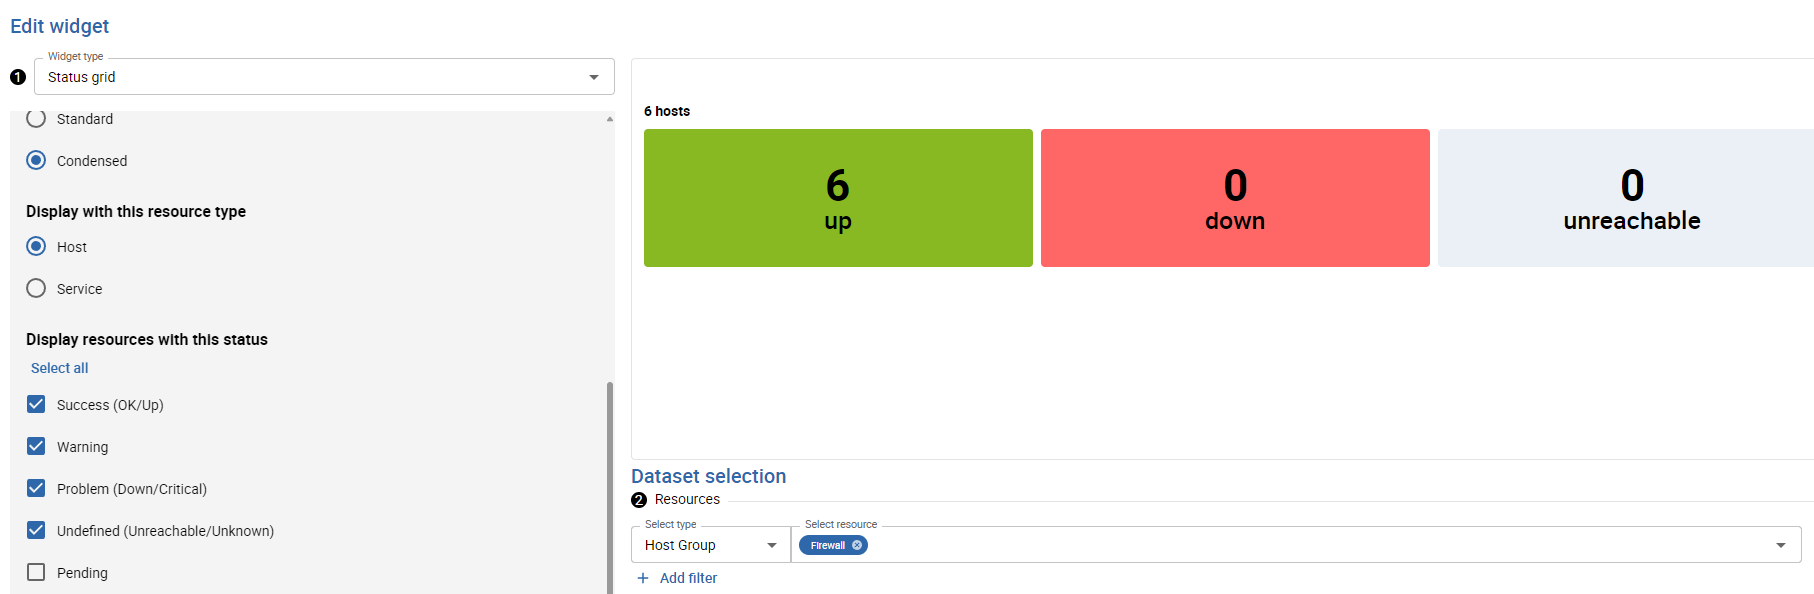
(this is a test platform with IT-100 edition, 24.04, latest patch from last week)


tested that on 2 different platform, I have the same behaviour. is anyone else getting the same result?

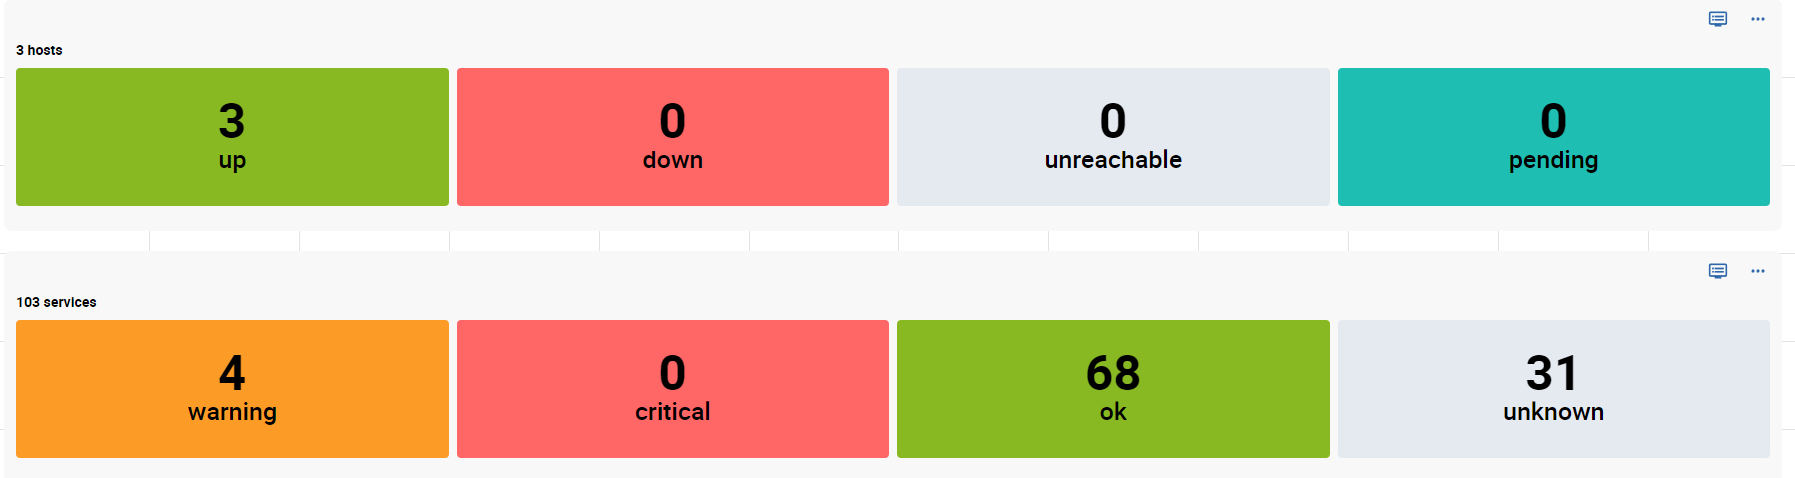
9 replies

Forum|alt.badge.img+6
  • Steward ***
  • Nov 15, 2024 1:39 PM UTC

Hello !
We do have the same problem on 24.04.7 ! 
We remark it on Warning  but it’s similar : like the count is 2 times or 2times+1 more on Grid than in reality


Forum|alt.badge.img+17
  • Author
  • Centreon Lord Commander
  • Nov 15, 2024 1:47 PM UTC

hello

I had forgotten this post, as if was fixed with the patch, I only have that dashboard for host (up and down), no services

are you saying the issue is still here on the services tiles? (can you send a screenshot?)


edit: i just add a test dashboard on a centreon test machine

the numbers are ok for me and this is 24.04.7


Forum|alt.badge.img+6
  • Steward ***
  • Nov 15, 2024 1:52 PM UTC

Hi 

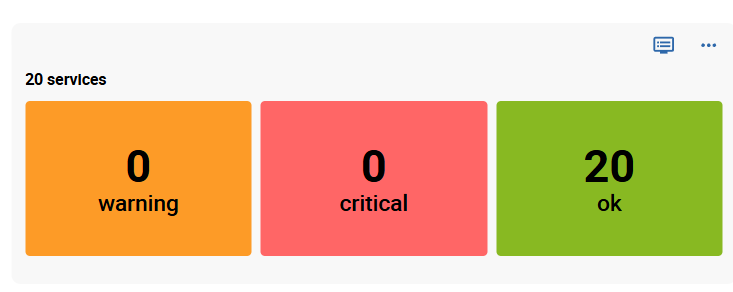
just test it on 24.04.7 with service :
I make the grid with a filter for One Host

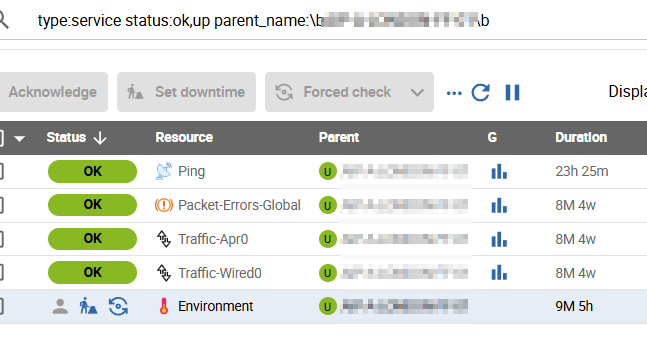
but clicking on the 20 ok I get (the reality) : 


I just remark that 20 is the number of Metric associated to this host..


Maybe the widget count the numbe of metric instead of number of services ? I have to check if it’s just by chance


Forum|alt.badge.img+17
  • Author
  • Centreon Lord Commander
  • Nov 18, 2024 10:59 AM UTC

I just tried to make a dashboard filtered on a single host, it has 8 services and the dashboard report only 8.

quick question, did you update in 24.04.7 recently ? (sometimes there is a cache to purge after the update)


Forum|alt.badge.img+1
  • Steward *
  • Nov 25, 2024 11:01 AM UTC

Hello,
i’m getting similar issues I think. May I add it here ?
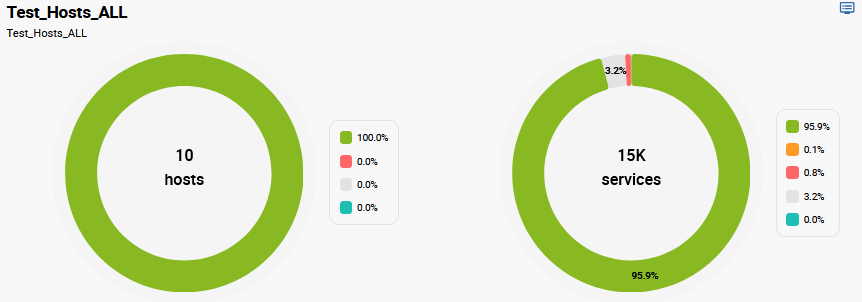
I have a host group for ALL my hosts. (hundreds). It states 10 hosts but when I click, I get the wright number in the grid window.
Same issue with services. 15K = wrong number. I get the exact number when I click on it and a grid window opens.
(Update to 24.04.07 a month ago)


Forum|alt.badge.img+8
  • Centreonian
  • Nov 26, 2024 10:05 AM UTC

Hello,

Sorry for the inconvenience, it should all be fixed now.

  • issue on Status Grid widget in condensed view has indeed been fixed in 24.04.7
  • issue on Status Chart widget has been fixed in 24.04.8


Forum|alt.badge.img+1
  • Steward *
  • Nov 27, 2024 11:29 AM UTC

OK Problem solved with Update → 24.04.8. Thanks


Forum|alt.badge.img+1
  • Steward *
  • Nov 19, 2026 12:26 PM UTC

problème revenu sur version 26.10


Adrien Morais-Mestre
Centreonian
Forum|alt.badge.img+8

Hi ​@daval 

Thanks for reporting this. I've looked into it, but we can't reproduce the issue on our side.

Why I don't think the original bug is back

  • The original issue was the condensed view counting all hosts and ignoring the host group / host category filter. It was fixed in 24.04.7 by changing how statuses are counted: the result limit was removed and results are grouped per resource. That fix is still in 26.10 and in our current development branch.
  • The code behind the condensed view's counters (the host and service status count endpoints) has not changed in a way that could bring that behaviour back. The only recent change in this area is the new "states" filter (acknowledged, in downtime, etc.). It can only narrow the count; it cannot inflate it.
  • We tested the counters against the Resource Status listing for every host group on our test platform, for both hosts and services. The totals and the per-status counts match in every case.

So we think you may be seeing a different problem, perhaps tied to your configuration. To investigate, could you share:

  1. The widget configuration: resource type (host or service), the filters used (host group, host category, service group, regex, etc.), and the selected statuses and states, if any.
  2. What you see and what you expect: the number shown in the condensed tile, and the real number (for example from Resource Status with the same filters).
  3. Whether the user viewing the dashboard is an administrator or not. Non-admin users go through ACL rules, which use a different query.
  4. A screenshot of the widget in condensed view and of its settings, if possible.
  5. Whether the standard (non-condensed) view of the same widget shows the right numbers.

With these details we can reproduce your case and check whether it is a new issue.

Thanks!

Adrien