I'm encountering some issues with the Centreon dashboard.
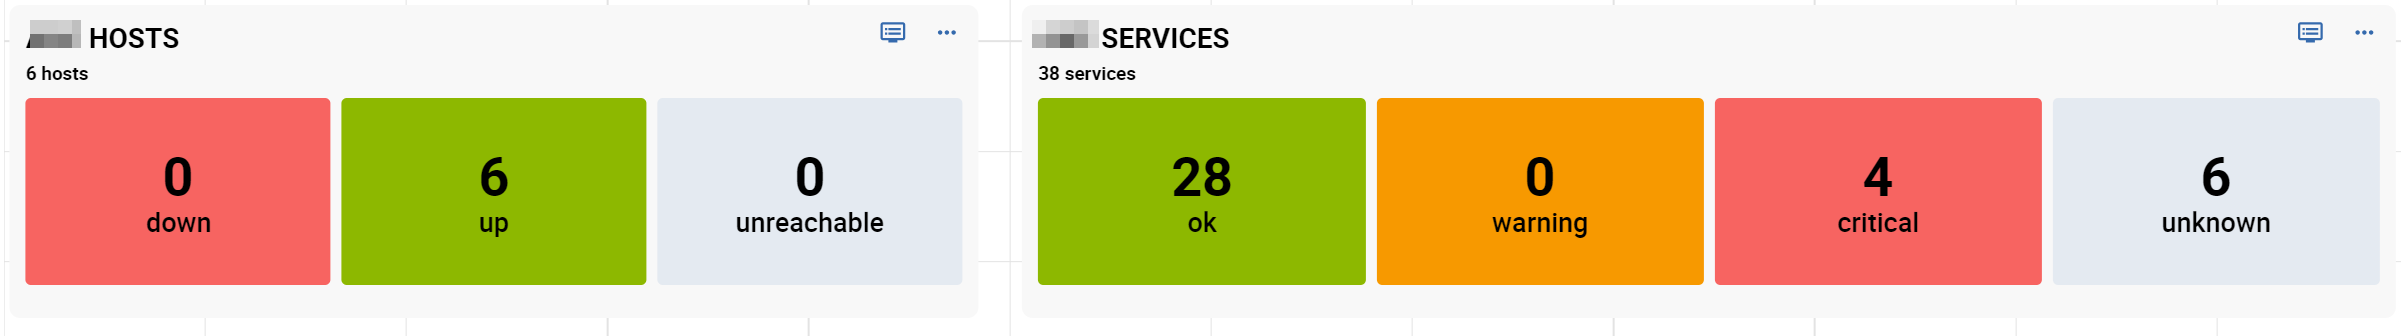
When I create a dashboard and choose the "status grid" widget type, I notice that some services are in "warning," "critical," or "unknown" states within the dashboard.
However, in Centreon, all services seem to be in an "up" state.
Could you help me resolve this issue?
Best answer by Adrien Morais-Mestre
@z123 Perfect thanks.
You can modify the following file on your platform to patch the issue for the hosts.
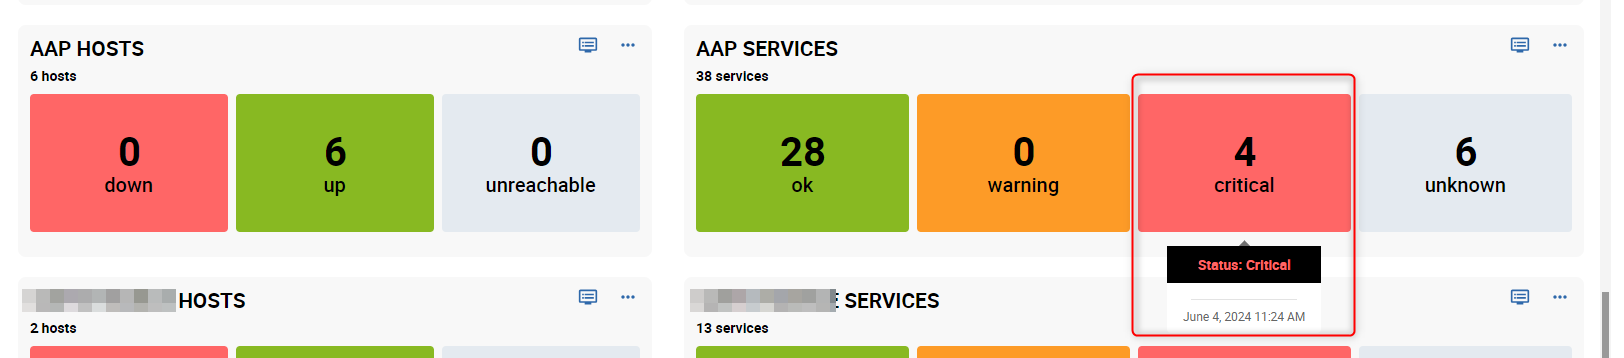
I believe this might be because the dashboard widgets do not properly filter out resources that are aknowledged or in downtime. Can you confirm the state of your critical services by clicking the 4 Critical tile?
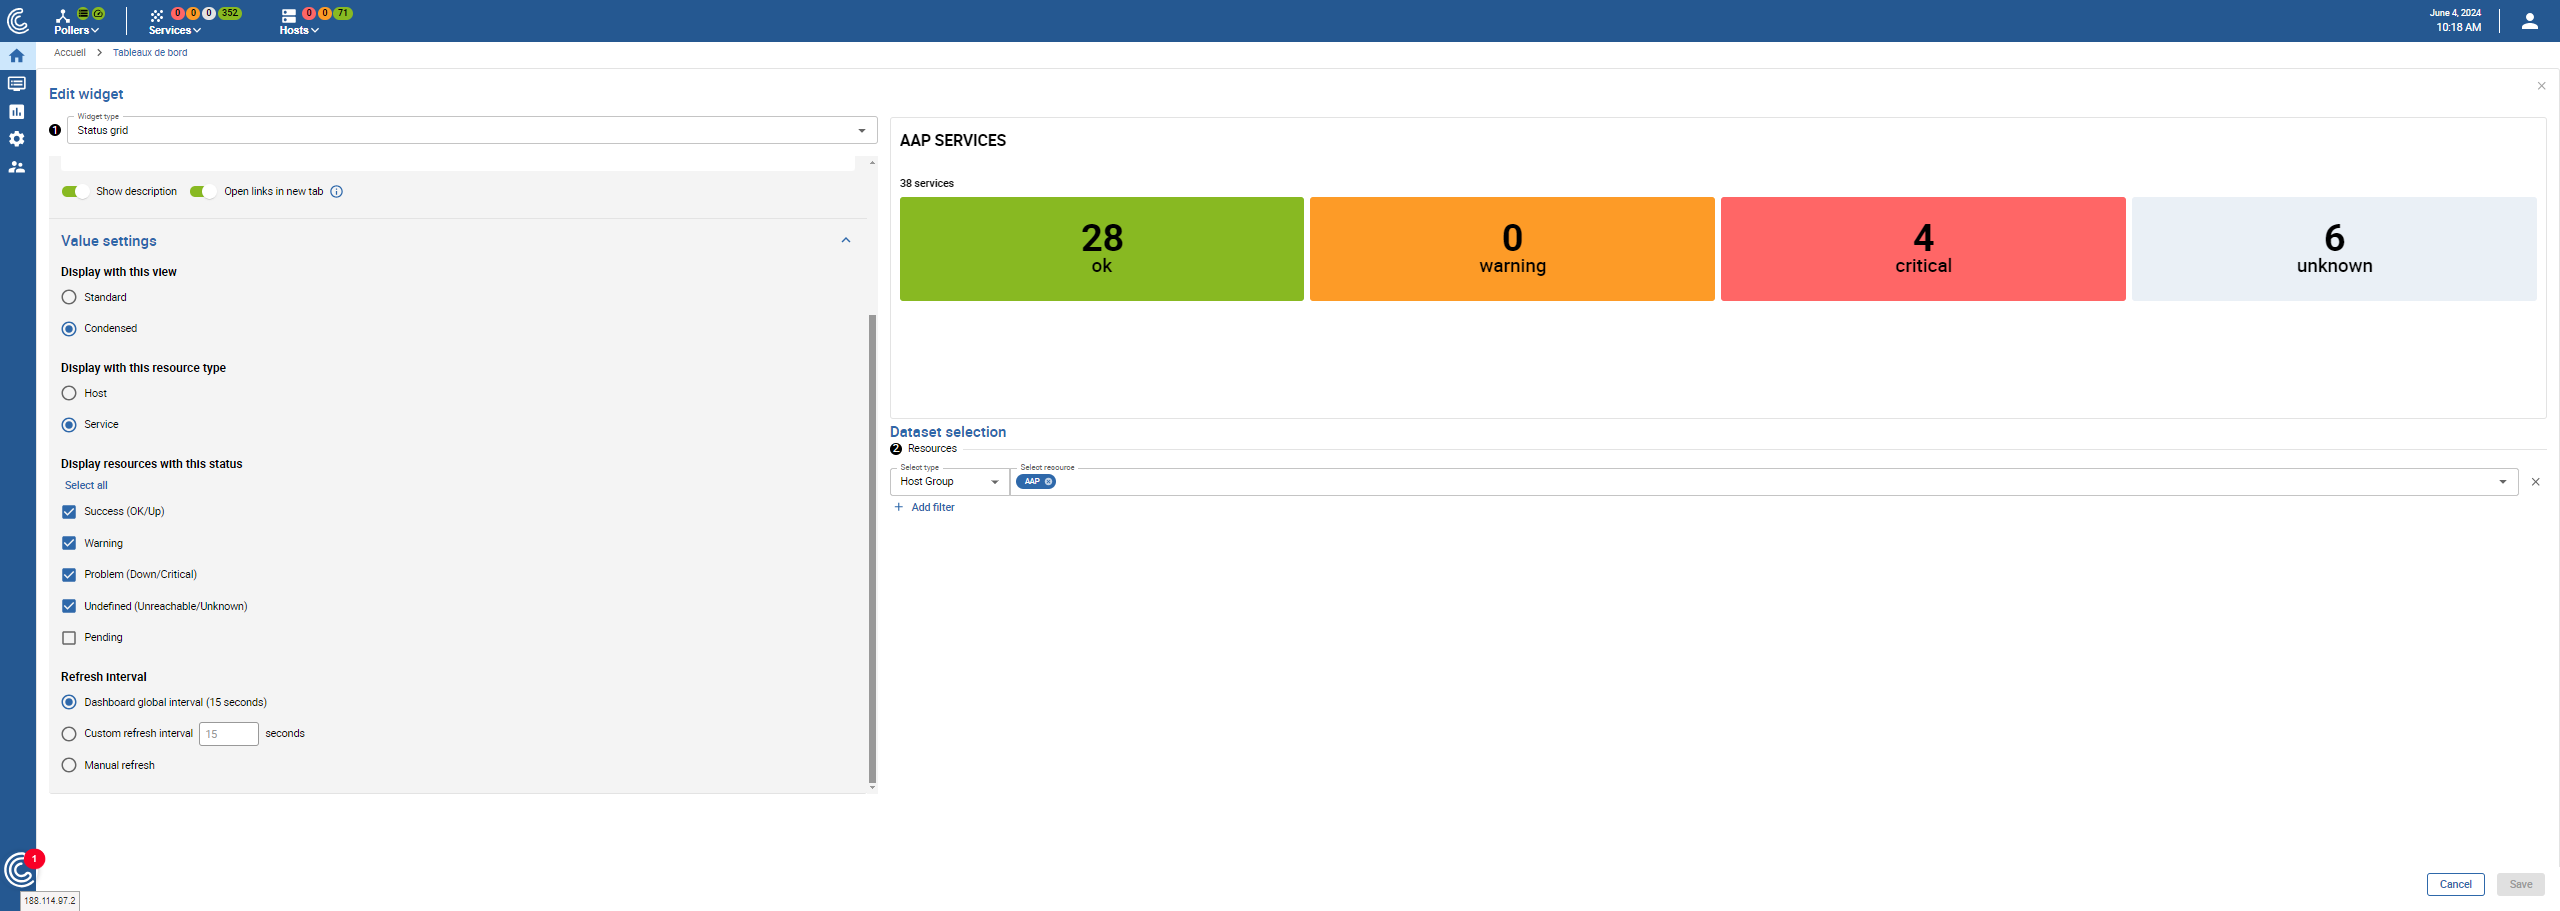
Would you mind sharing your SERVICES widget settings (a screenshot with both Widget Properties and Dataset Selection would be helpful as I really don’t see why this inconsistency)?
Thanks. When you mouse over the “4 critical” tile you should see the list of services in a tooltip. Do you see anything suspect here ? (services that were disabled or acknowledged or in downtime etc) ?
Awesome @Adrien Morais-Mestre this really fixed the issue but I wonder is this a workaround which will be overwritten after next update or is it a patch which will be applied next version update?
Also the same problem. I am speechless, dashboards are meant to replace views. But on this most basic widget we are forced to modify code ... What is your QA doing?
This problem is resolved in 24.04.5 but subsiste an anomaly when trying to filter on host groups regardless of the type of widget used. Will it be fixed in 24.04.6 ?