


Please note that the only procedures supported and maintained by Centreon are those published in the official documentation. If you have a question about this article, post it in the comments.
This article explains how to display Centreon performance data (graphs) in Grafana’s Time Series widget using the Infinity data source. This procedure has been tested with Grafana 12.
Prerequisites
- In Centreon Infra Monitoring, create an authentication token under Administration > Authentication Tokens. This token must have access to the resources you want to display in Grafana.
- The token must allow access to the Monitoring > Resources Status page.
- In Grafana, you must have access to data source configuration and to dashboard creation and editing.
In this article, we use Centreon Infrastructure Monitoring version 25.10.x (compatible with all supported Centreon versions) and Grafana server version 12 or later.
Step 1: Configure the Infinity datasource to call Centreon's real-time APIs
You will need the following information:
- base URL: {protocol}://{server}:{port}/centreon/api/{version}, for example https://www.mycentreon.net/centreon/api/latest
- header: X-AUTH-TOKEN: <your_centreon_authentication_token>
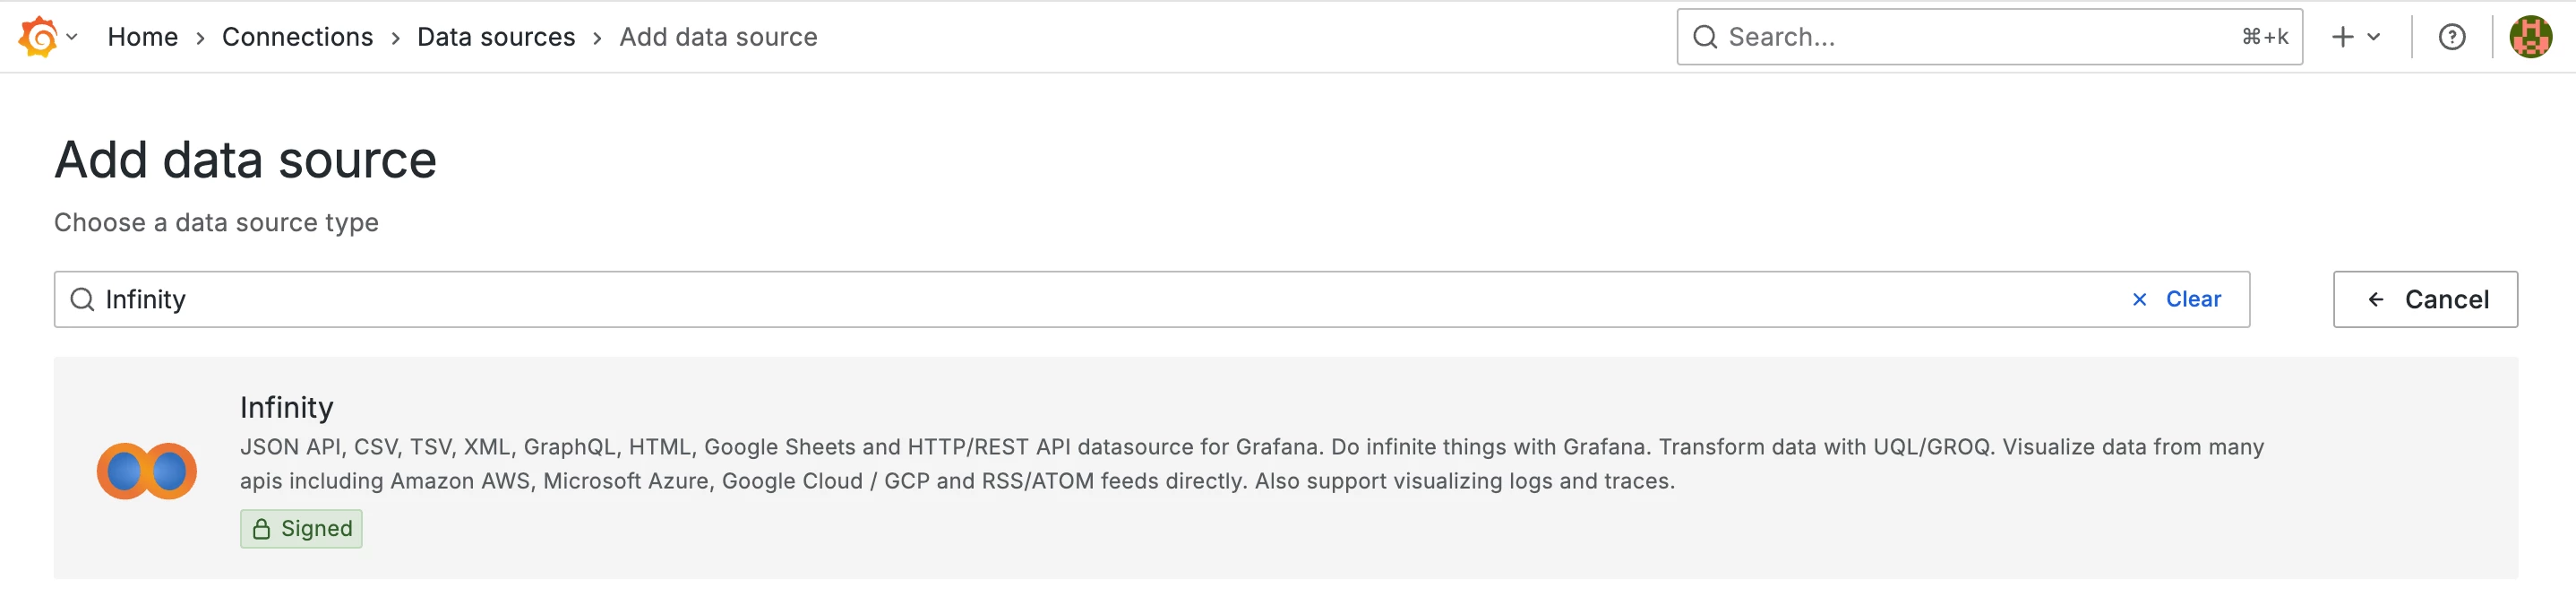
In Grafana, go to the Data Sources configuration menu and click Add new data source. Search for Infinity and click the result:
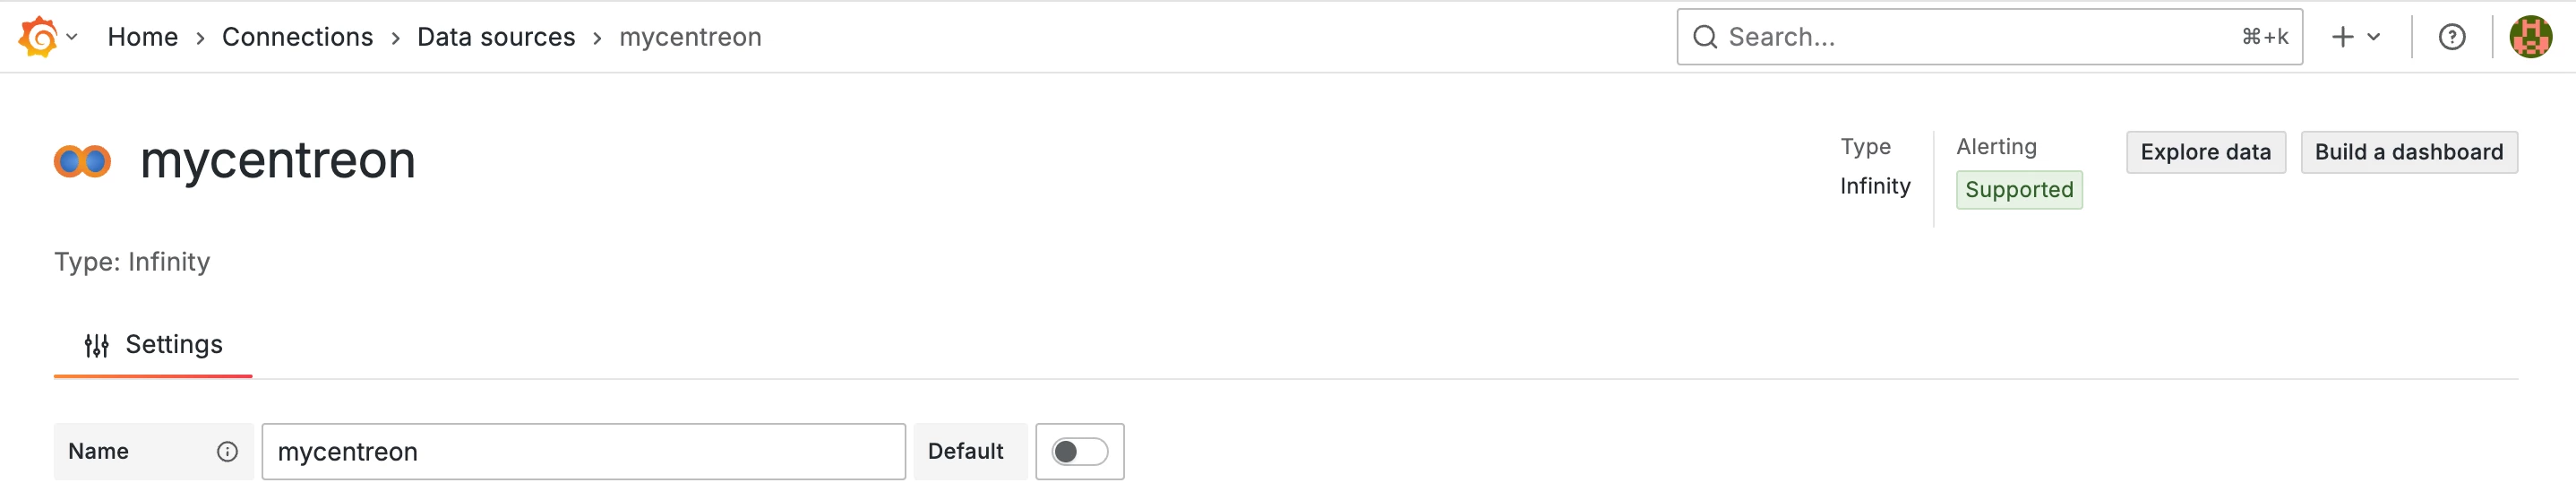
Define a name for your data source (in our example, mycentreon):
Go to the URL, Headers & Params menu, and enter your Base URL in the following form:
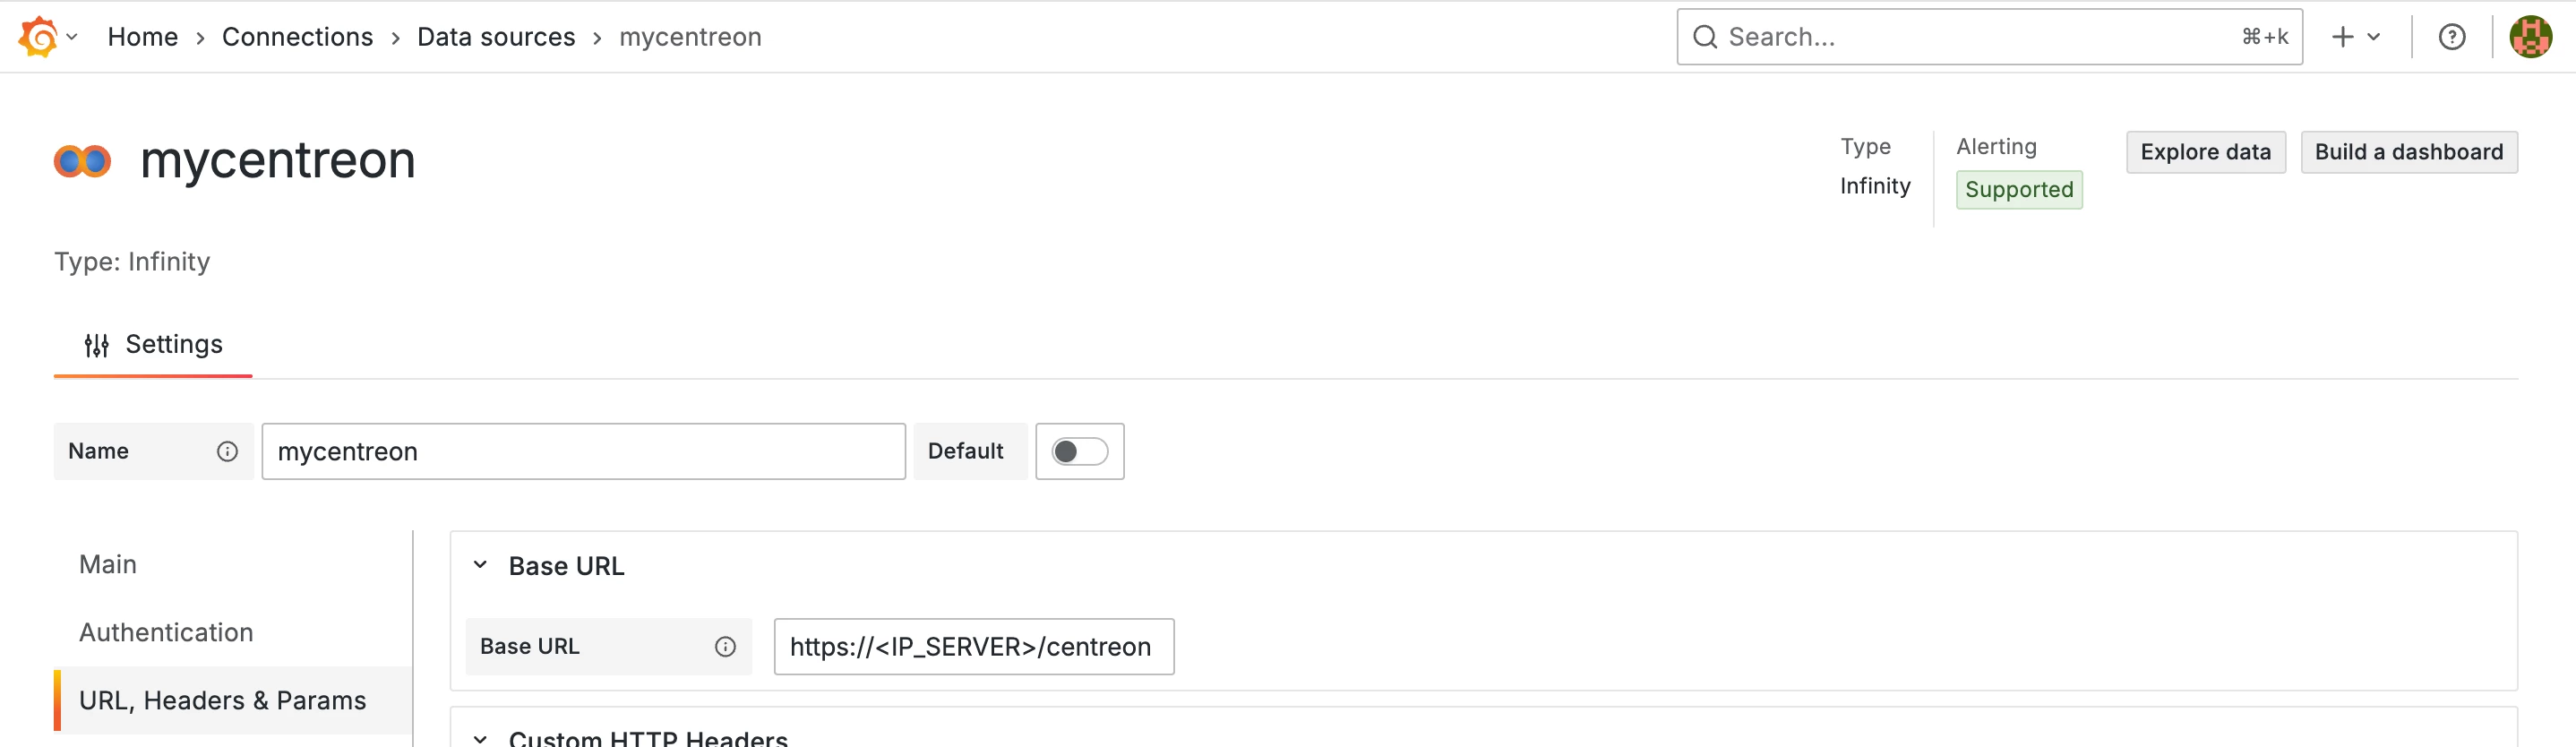
The URL must be in the form: https://<IP_SERVER>/centreon/api/latest
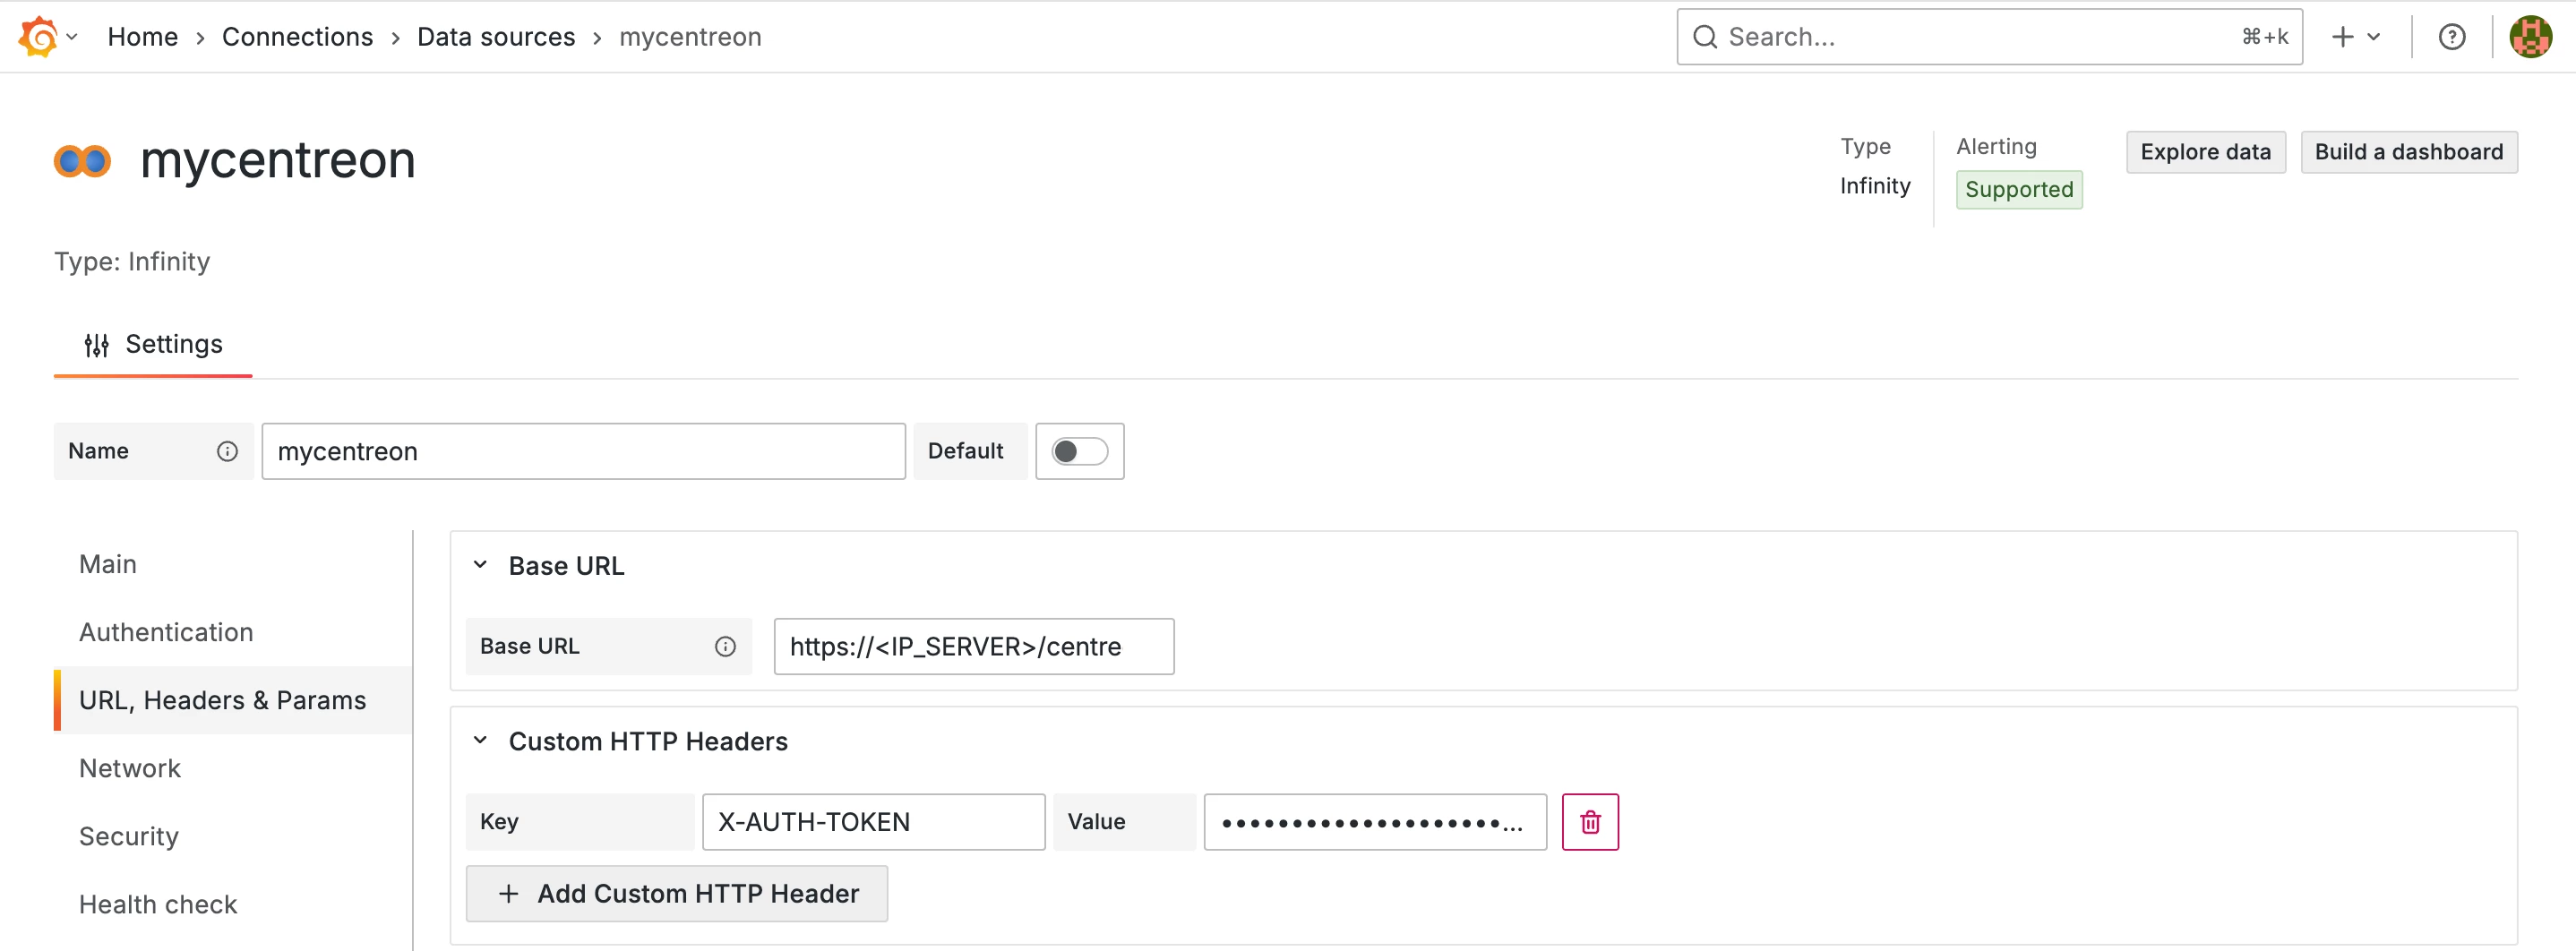
Click the Add Custom HTTP Header button and enter a key called X-AUTH-TOKEN. Add your token as the value:
To save your configuration, go to the bottom of the page and click the Save & test button:

Step 2: Retrieve the IDs of the resources you want to display in Grafana
Log in to Centreon Infra Monitoring and go to Monitoring > Resources Status. Find your resource and click on it to open the panel, then go to the Graph tab.
Open your browser’s developer tools, go to the Network tab, and filter by performance.
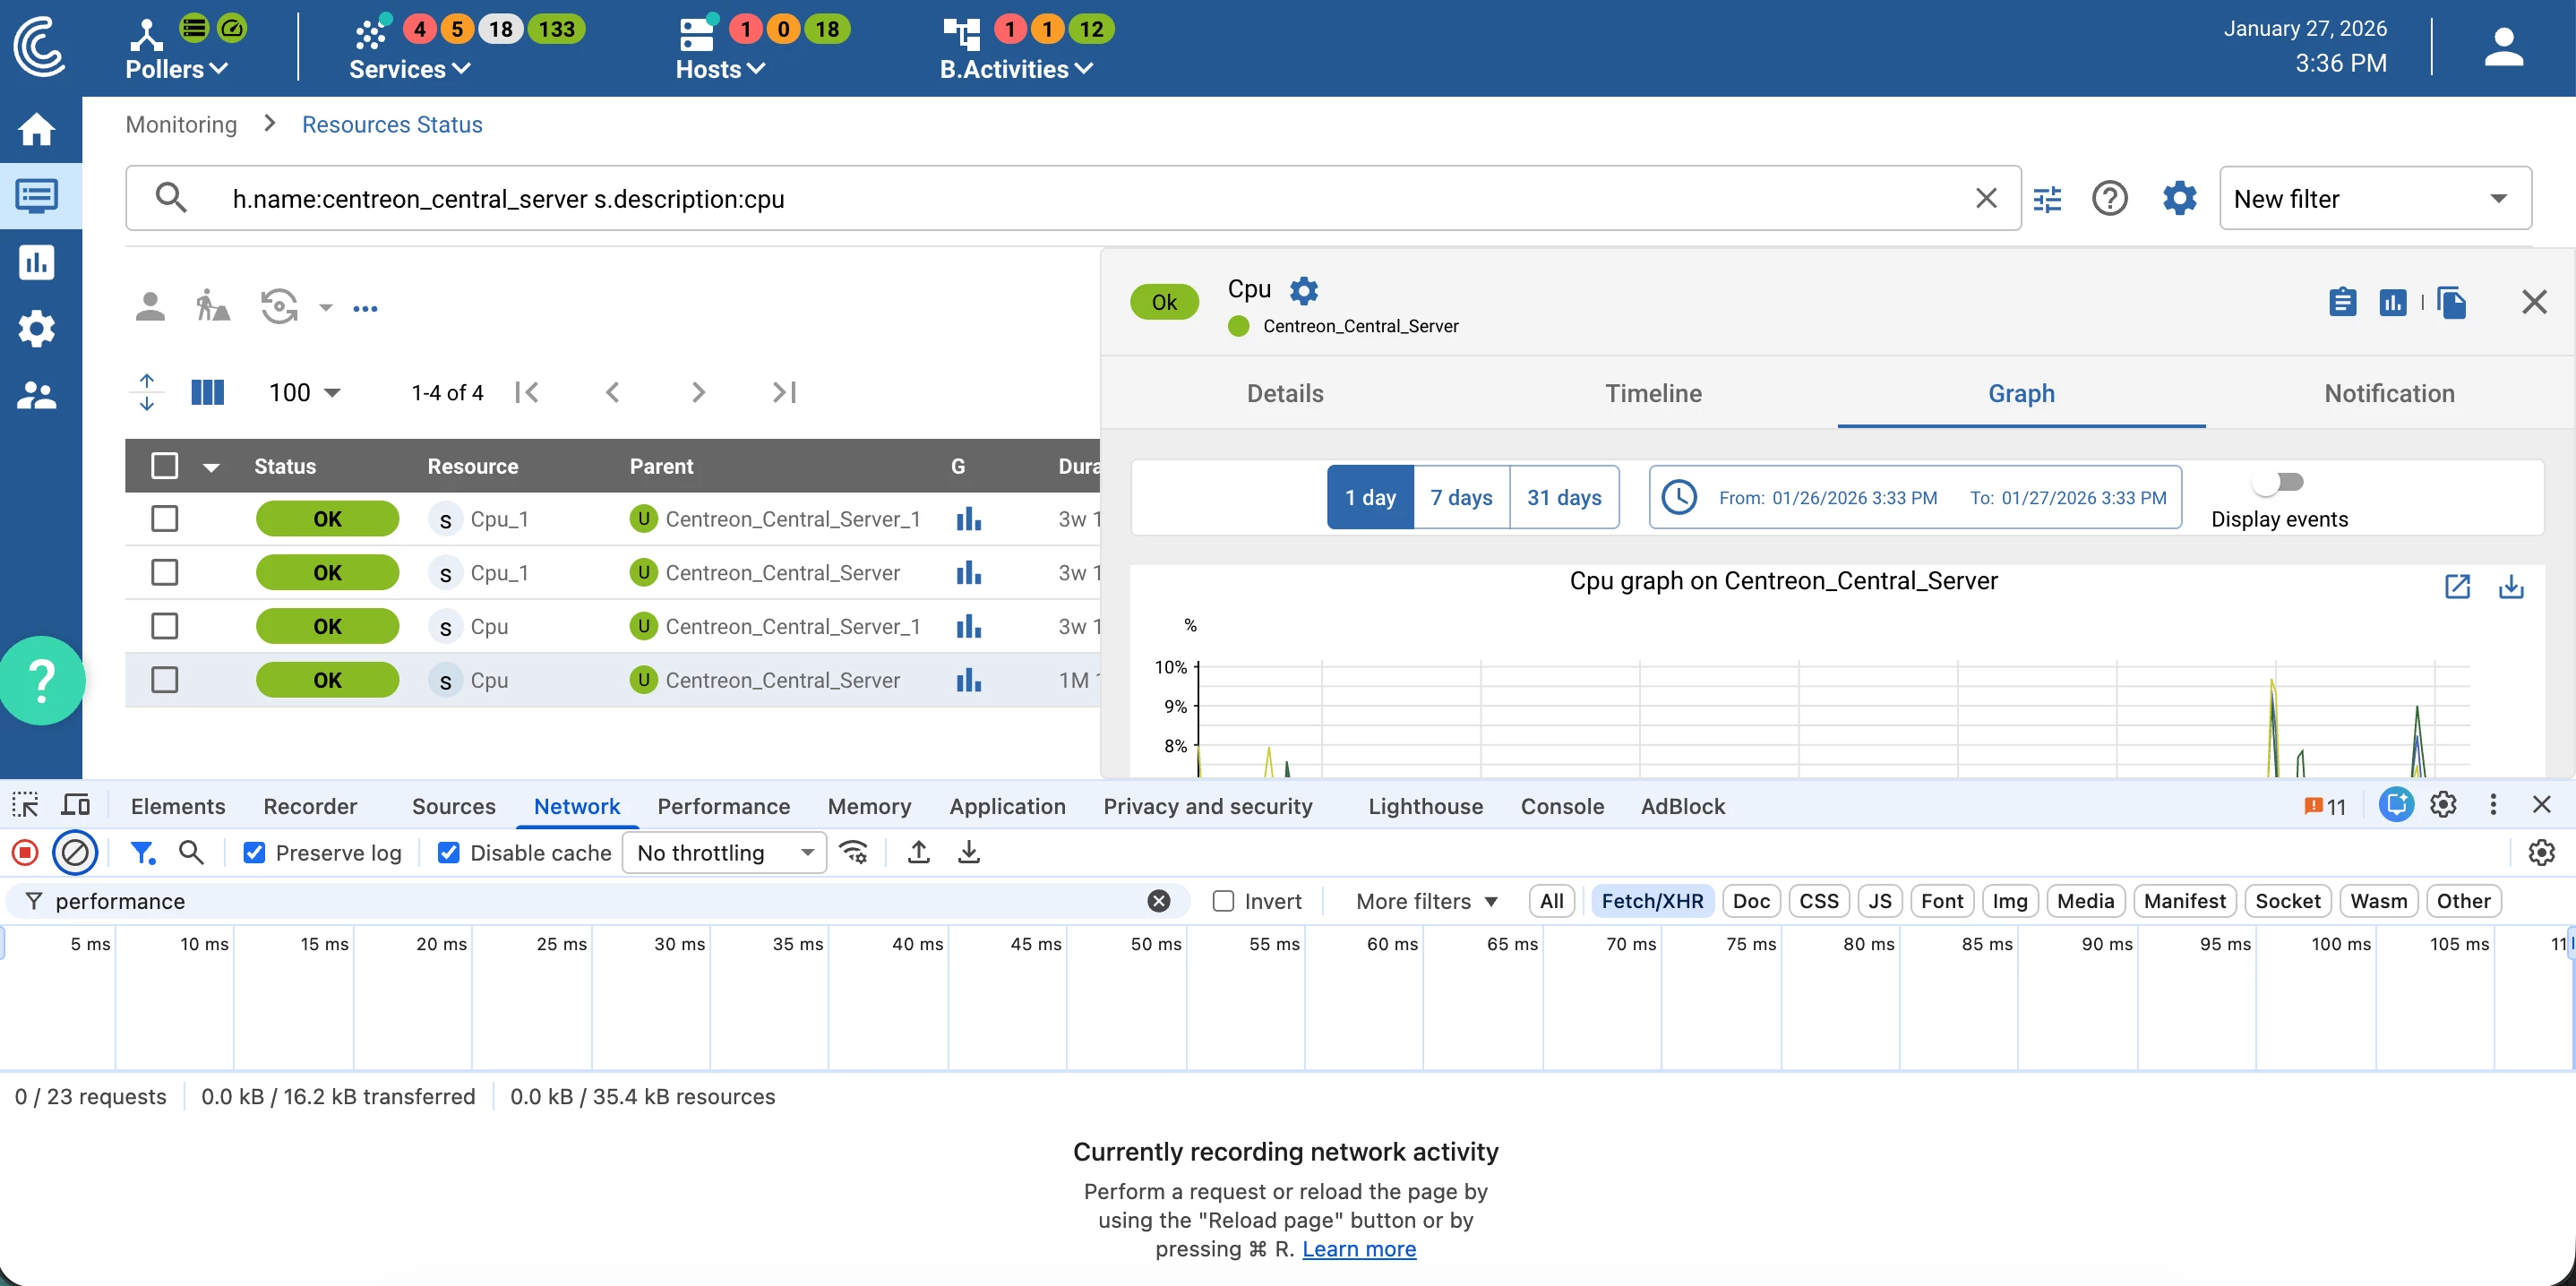
In Centreon, change the time period (1 day, 7 days, or 31 days). Then, in the developer tools Network tab, click the entry that appears:
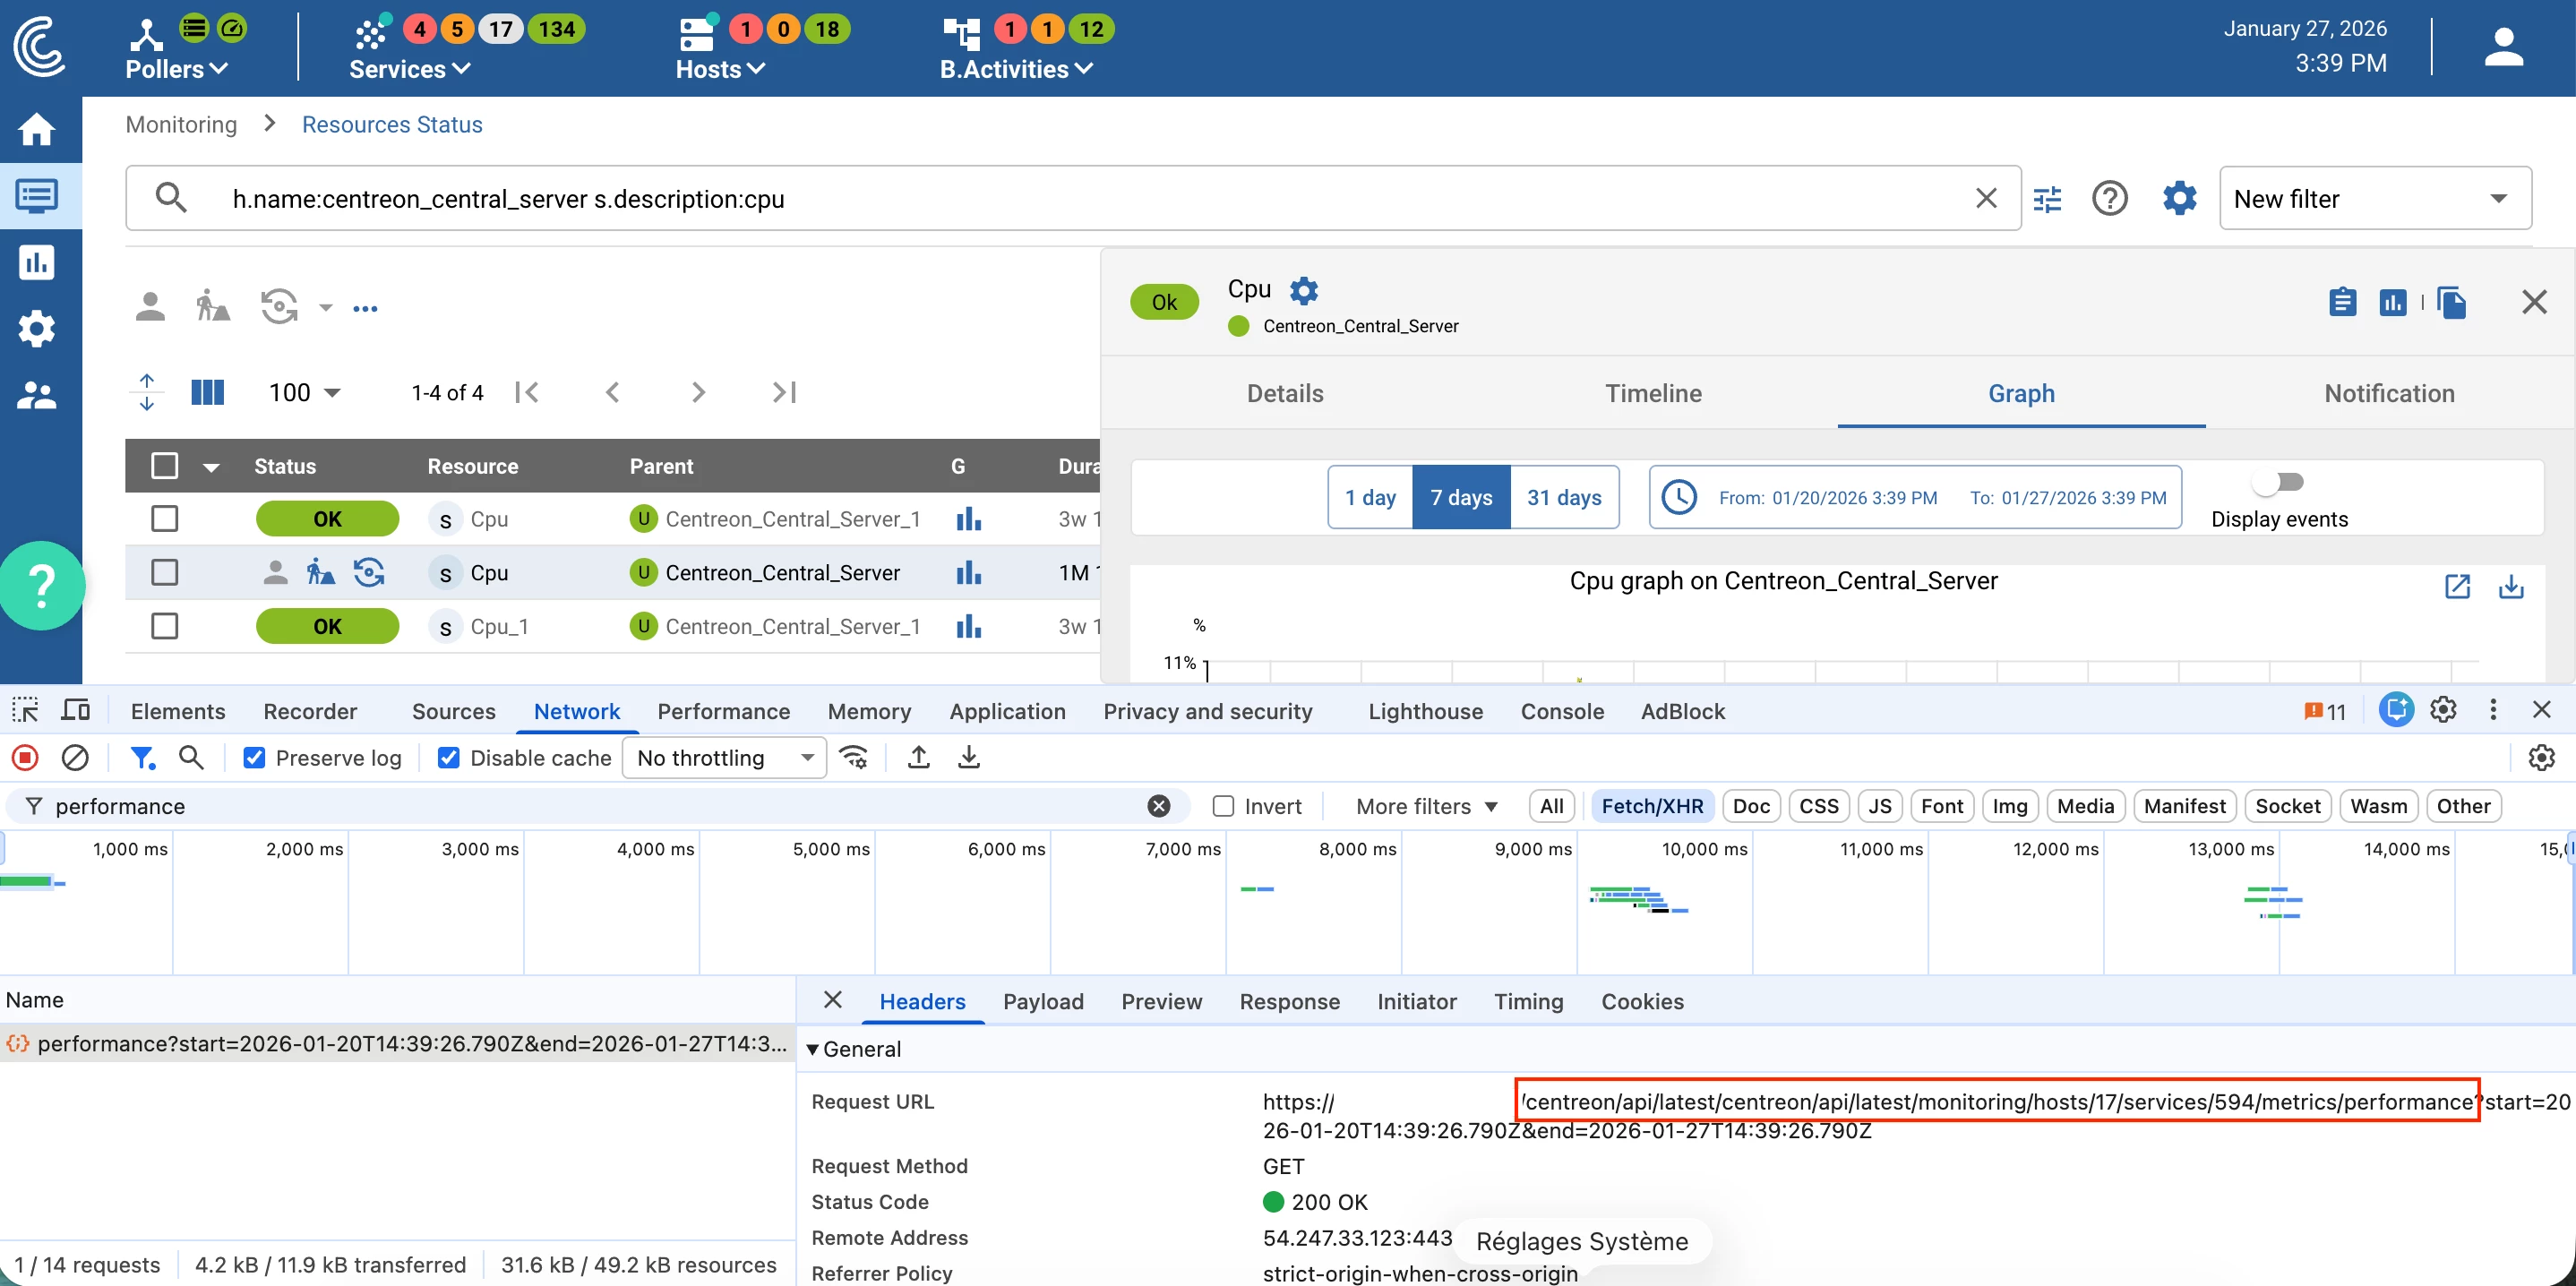
The Request URL field shows the host ID (17) and the service ID (594).
Step 3: Add your first widget
Create or edit a Grafana dashboard and click on Add visualization.
Select your previously created data source (in our example, mycentreon).
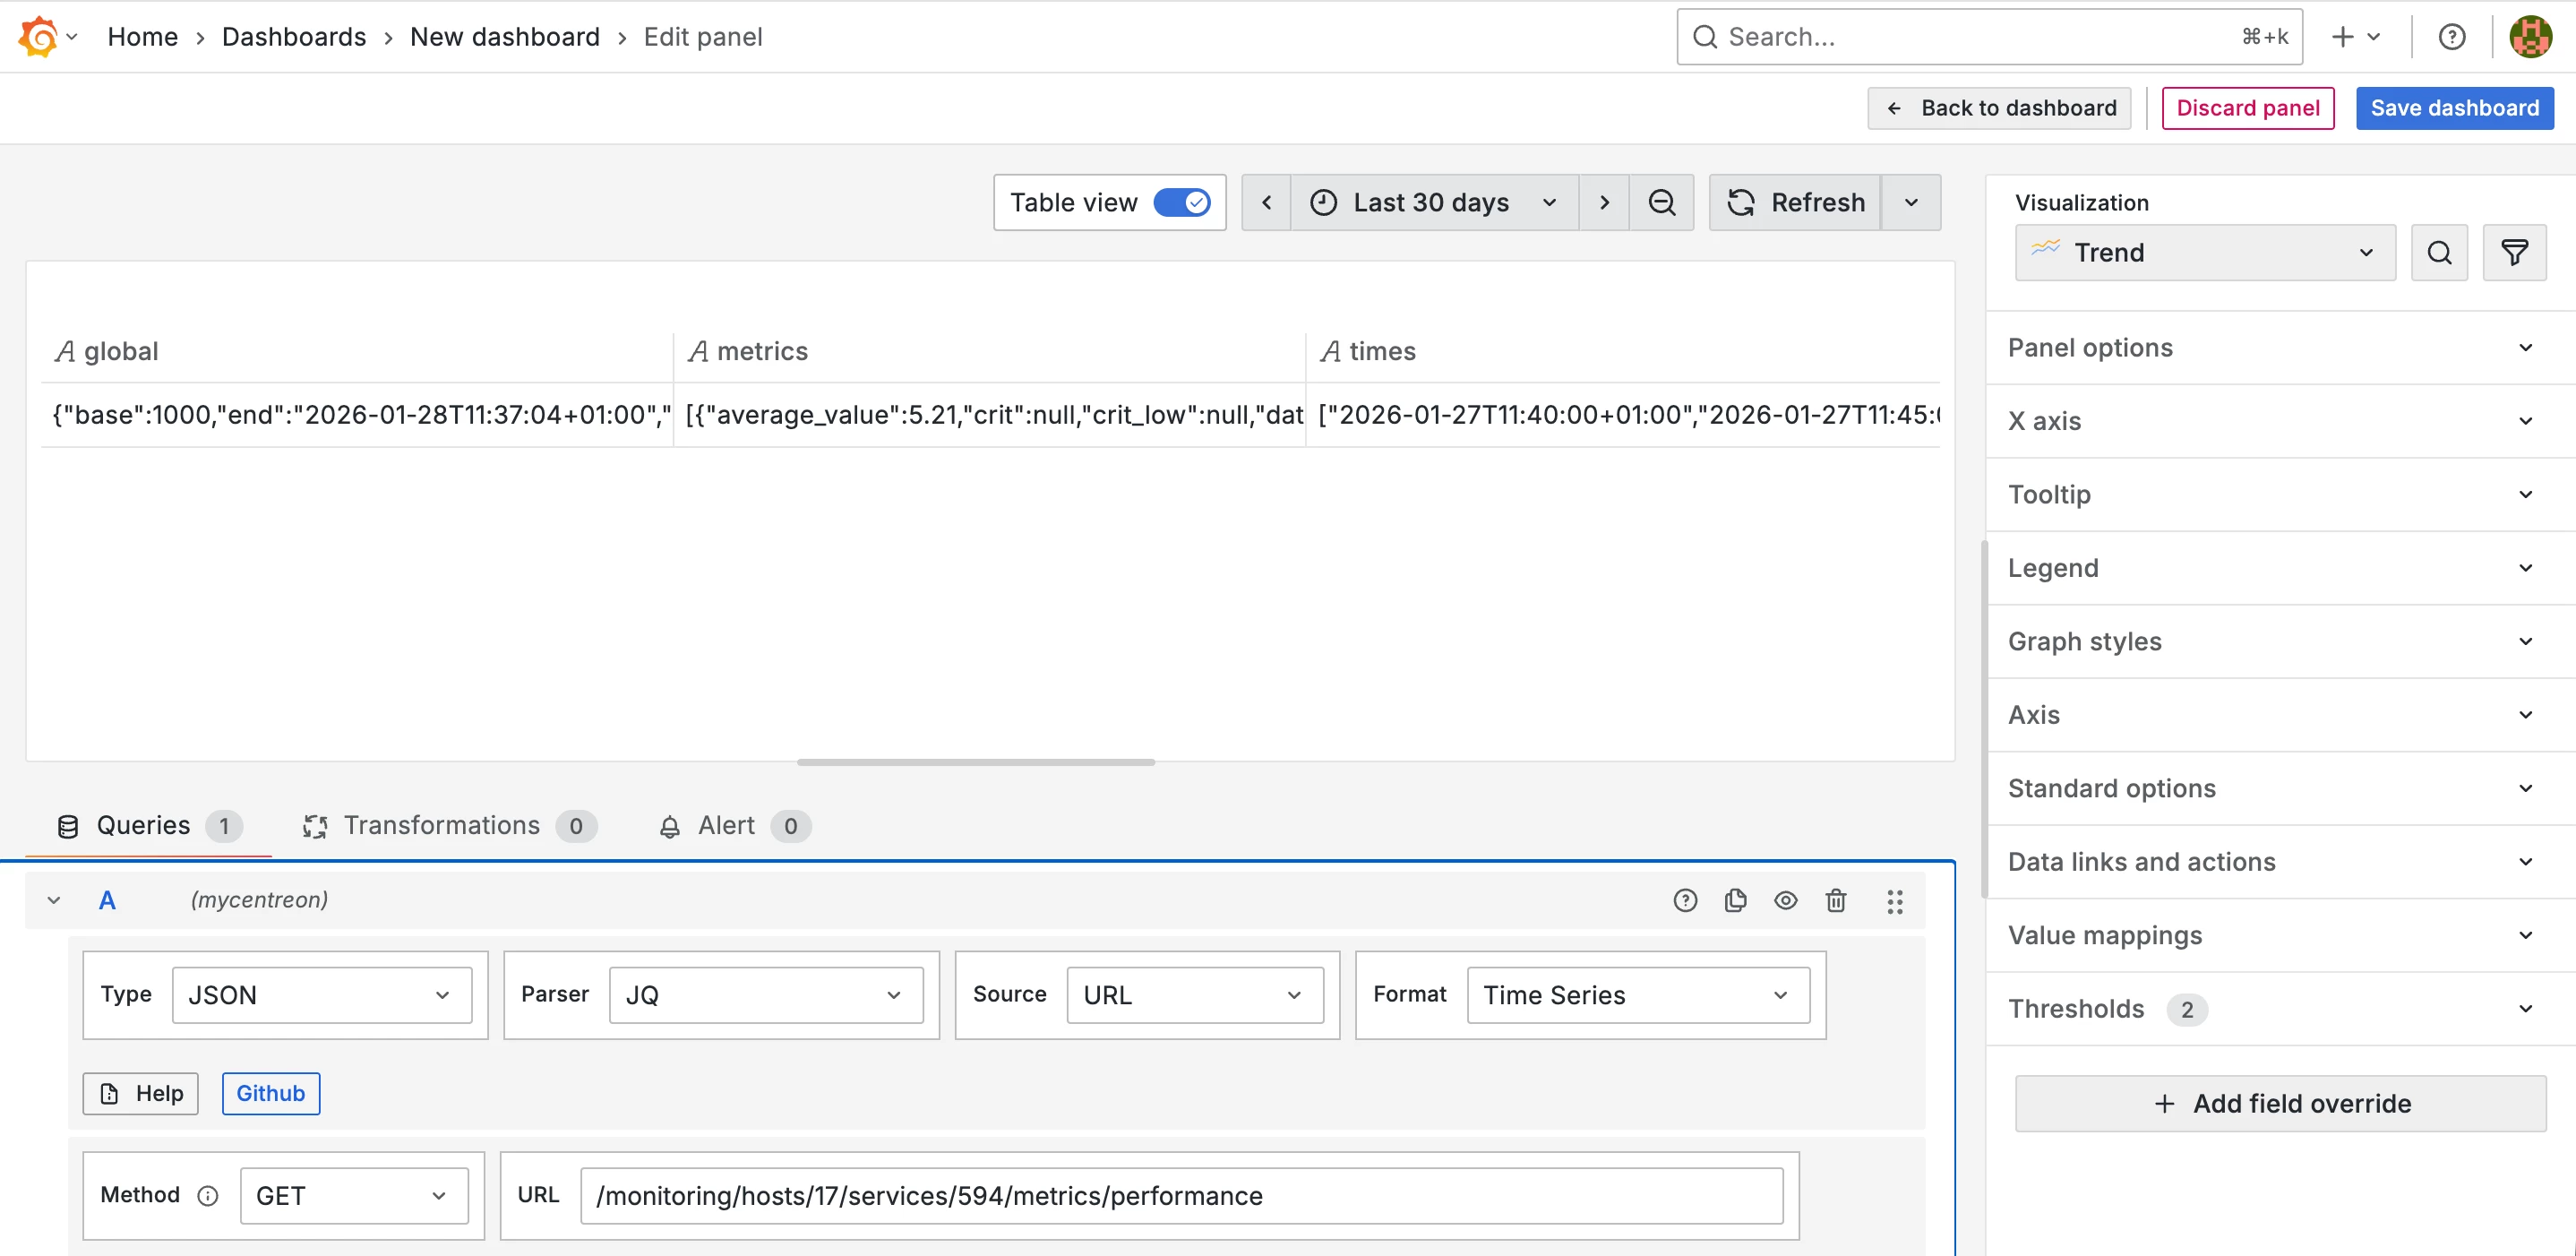
In the right panel, select the Trend widget from the Visualization list.
In query A, define:
- Type: JSON
- Parser: JQ
- source: URL
- Format: Time Series
- Method: GET
- URL: /monitoring/hosts/<HOST_ID>/services/<SERVICE_ID>/metrics/performance
Replace
<HOST_ID>and<SERVICE_ID>with the values you retrieved earlier.
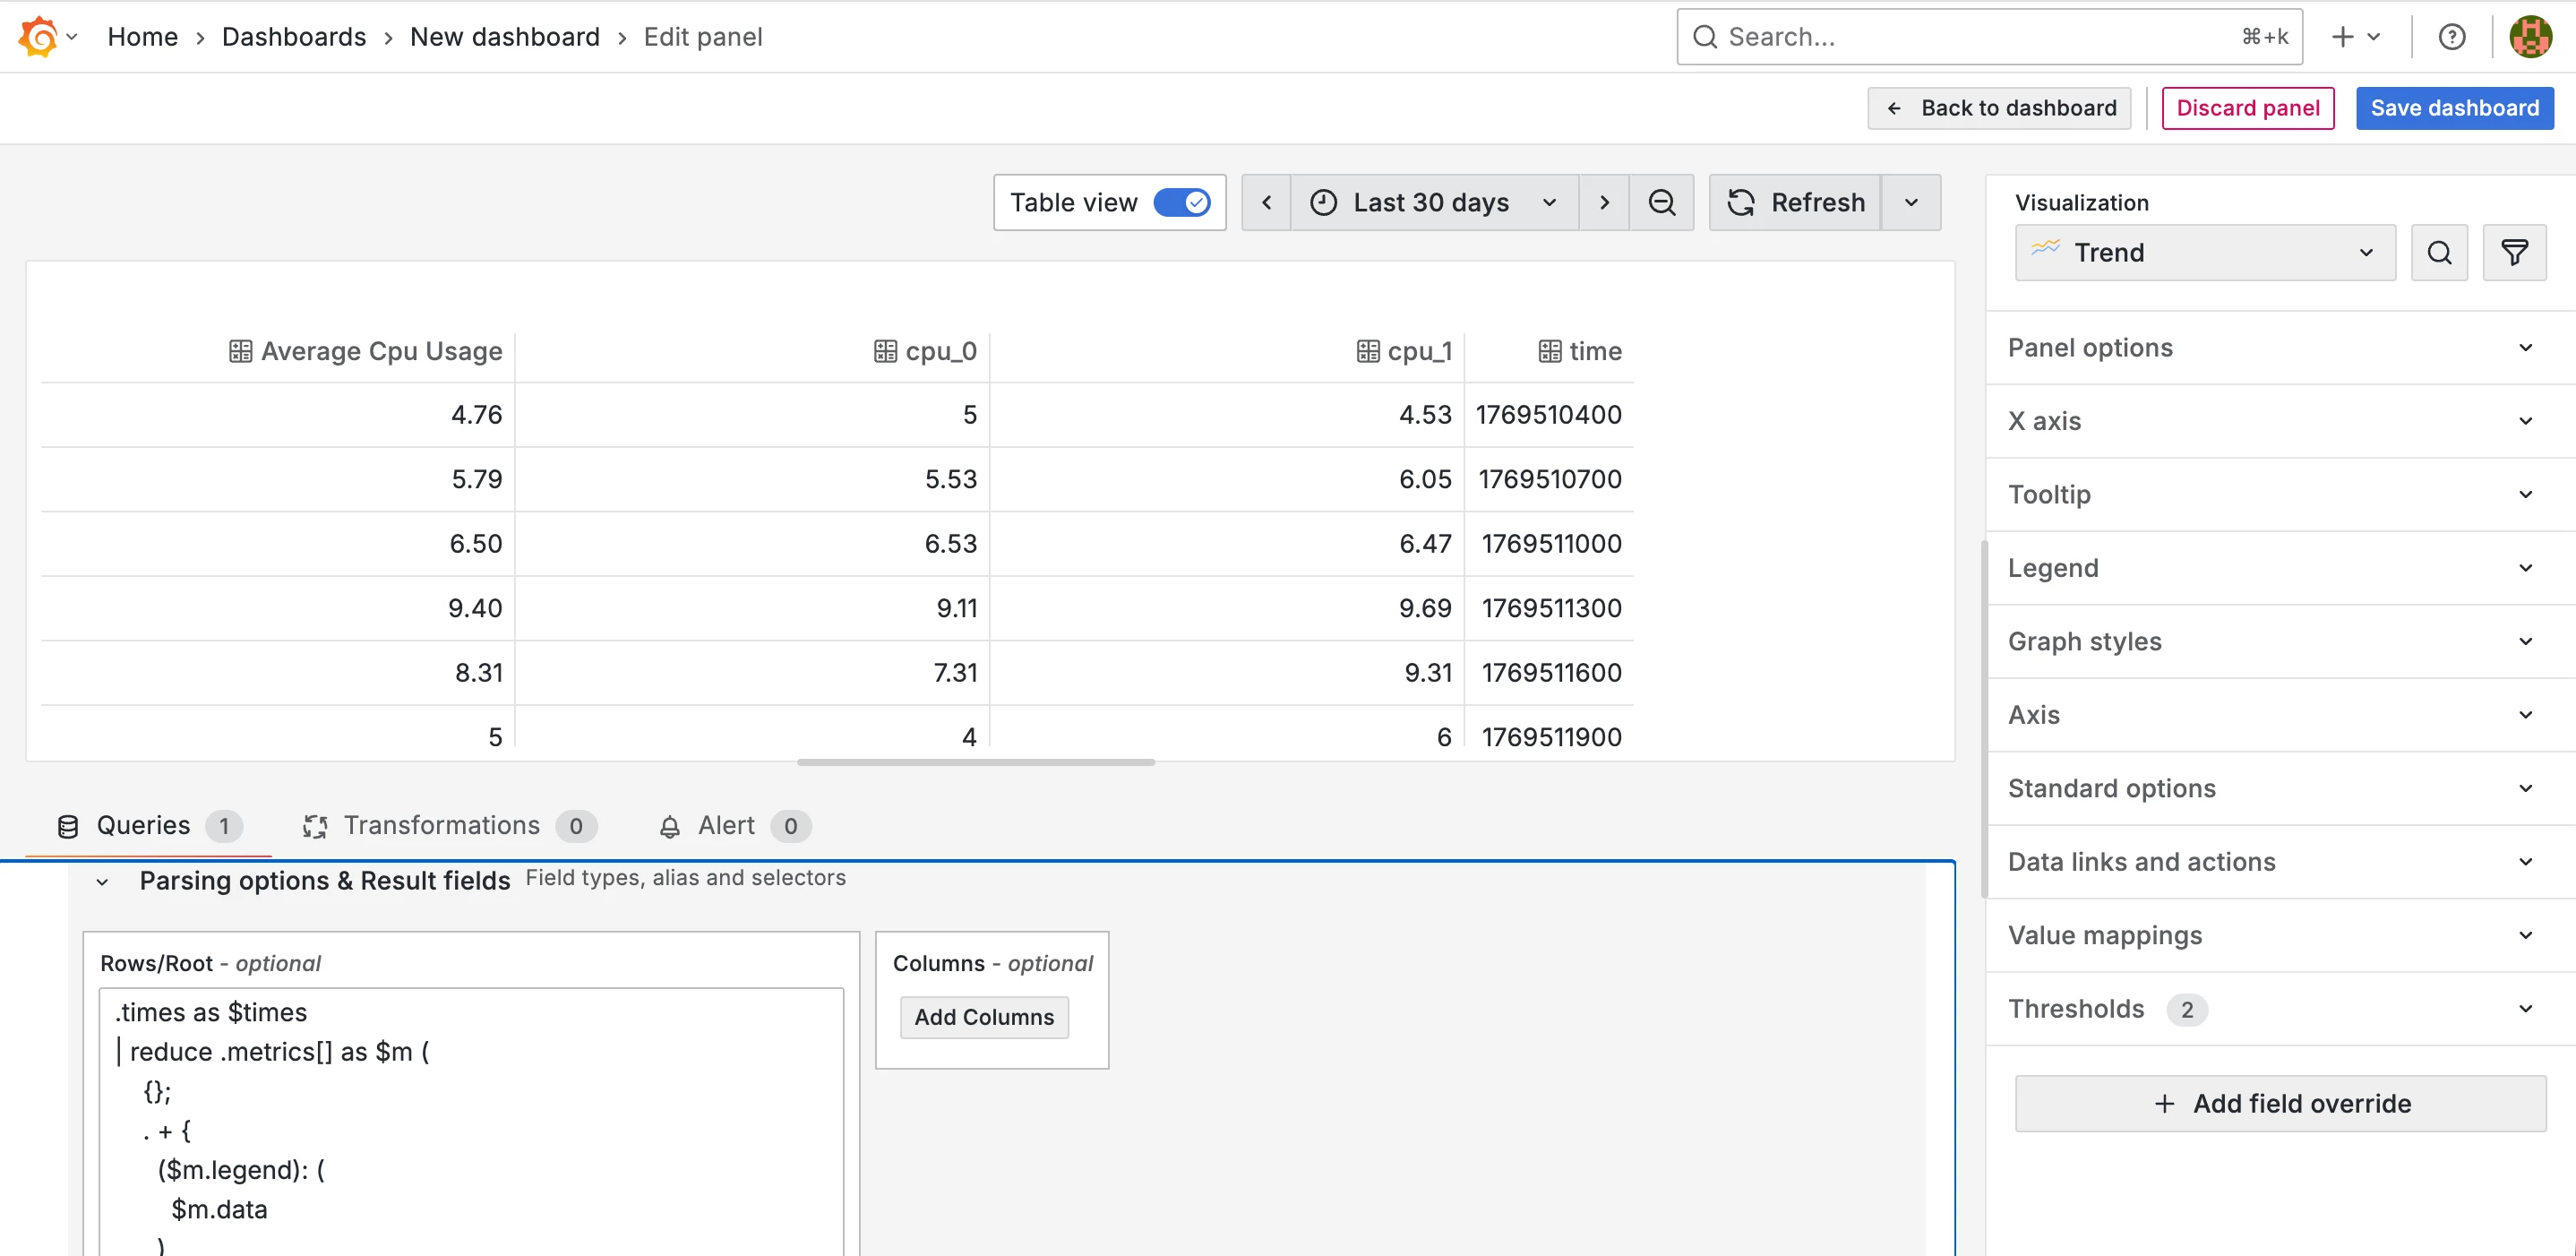
Enable Table view at the top of the settings, then click Refresh to run the query. The result should look like this:
The Centreon data format now needs to be converted to be compatible with the format expected by the Time series widget.
To do this, open the Parsing options & Result fields section of the query and enter the following code for the Rows/Root parameter:
.times as $times
| reduce .metrics[] as $m (
{};
. + {
($m.legend): (
$m.data
)
}
)
| to_entries
| . as $entries
| range(0; ($entries[0].value | length)) as $i
| (
{
time: ($times[$i] | fromdateiso8601)
}
+
reduce $entries[] as $e (
{};
. + { ($e.key): $e.value[$i] }
)
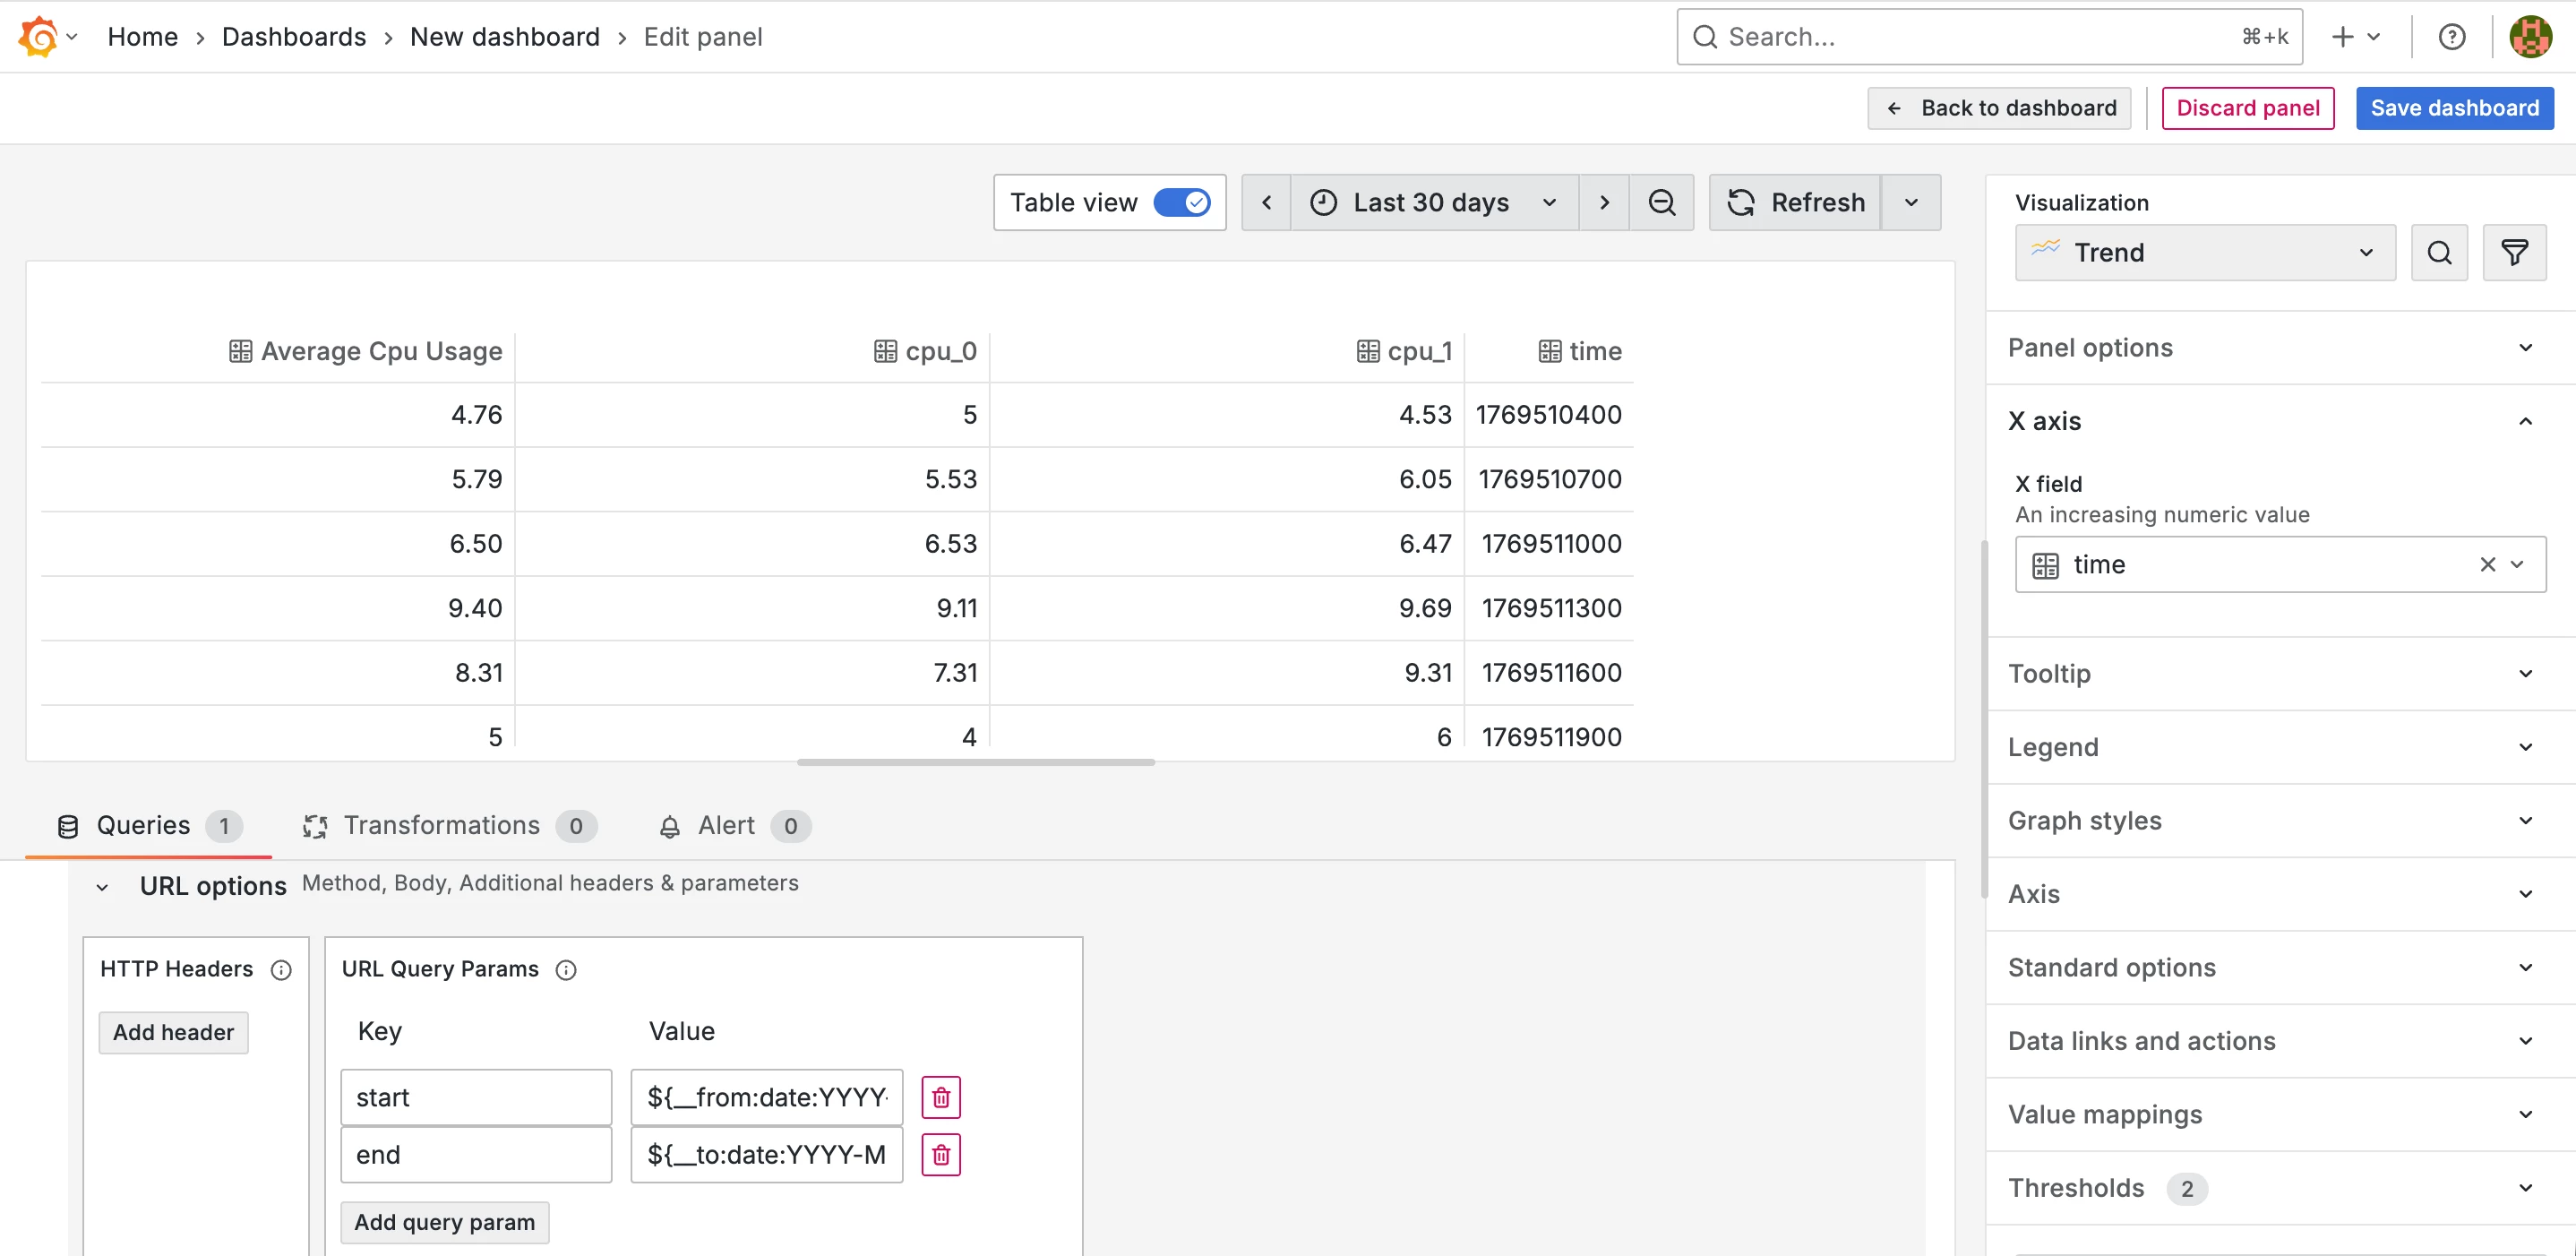
)Click the Refresh button. You should see something like this:
In the right panel, for the X axis section, select the time column.
In the URL options section of your query, click the Add query param button and add the following 2 entries:
| Key | Value |
|---|---|
| start | ${__from:date:YYYY-MM-DD HH\:mm\:ss} |
| end | ${__to:date:YYYY-MM-DD HH\:mm\:ss} |
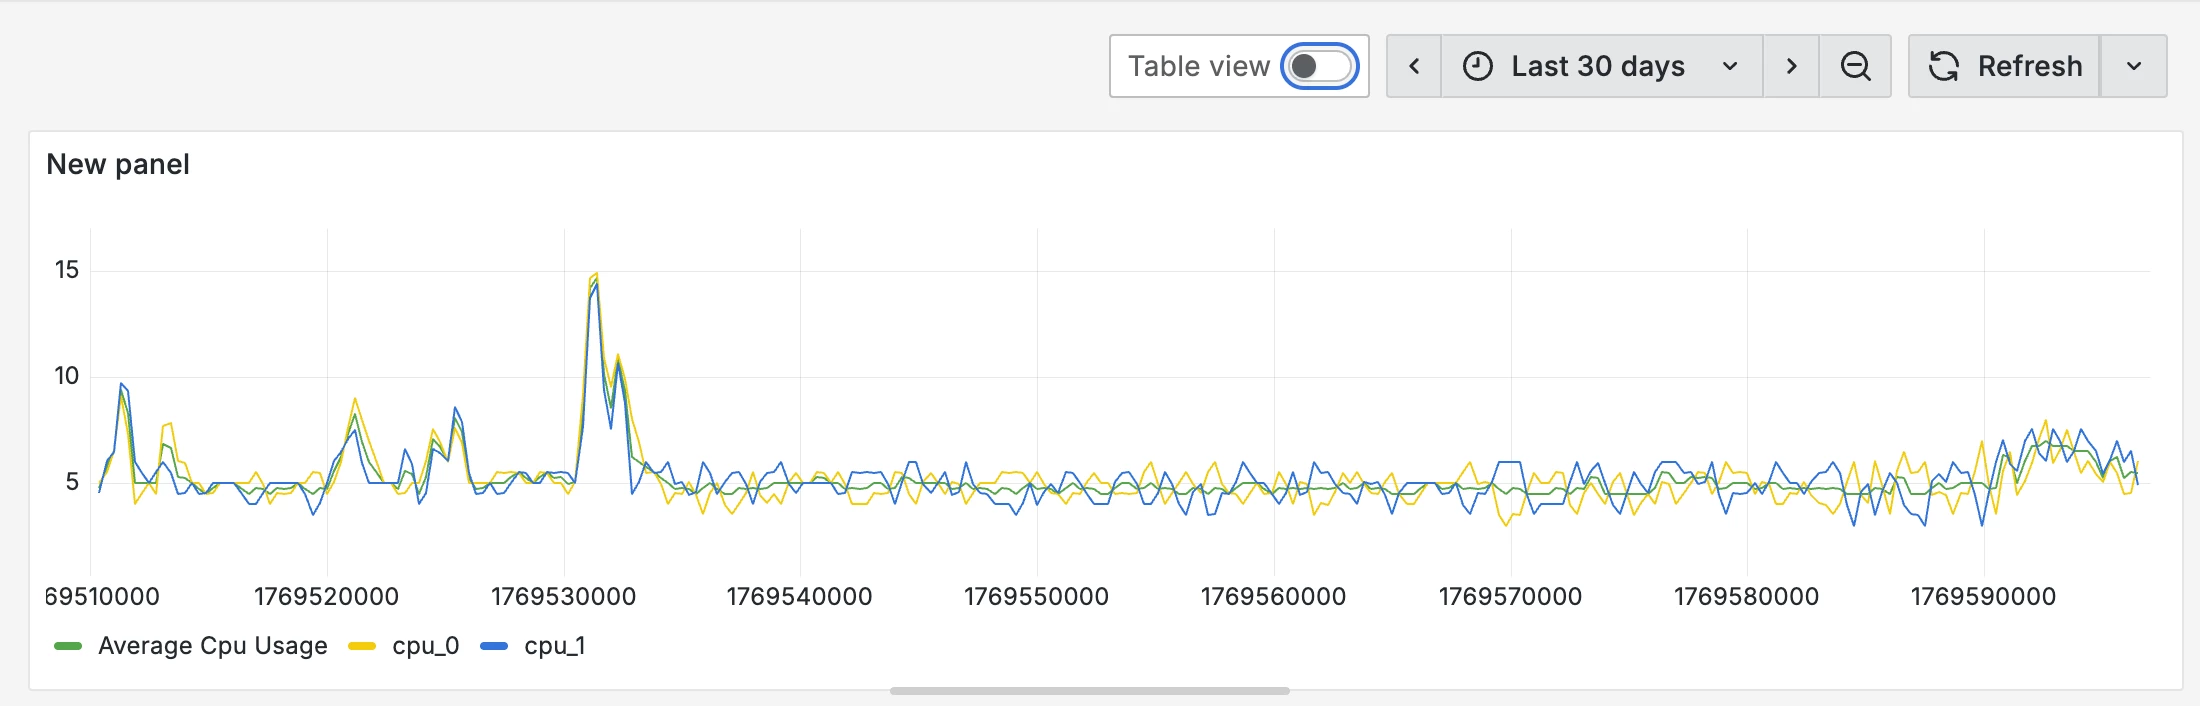
Uncheck the Table view option and click the Refresh button to run the query. The result should look like this:
Remember to save your configuration by clicking the Save dashboard button.
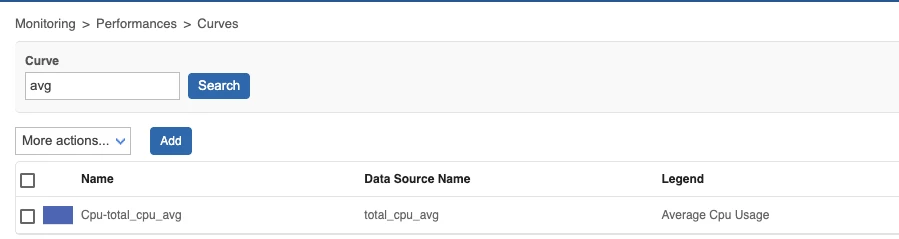
The names of the displayed curves come from the Centreon configuration. If you have overridden metric names in Centreon Infra Monitoring (Monitoring > Performance > Curves), the overridden names will be shown; otherwise, the metric names defined in the monitoring probe will be used. In our example, Average CPU Usage has been overridden:
If you want to filter the displayed curves or change how the data is formatted, you need to override the query parameters and use the Time Series widget.
If you change the column settings, make sure to define all necessary columns.
To do this, open the Parsing options & Result fields section of your query and add as many columns as needed using the Add Columns button.
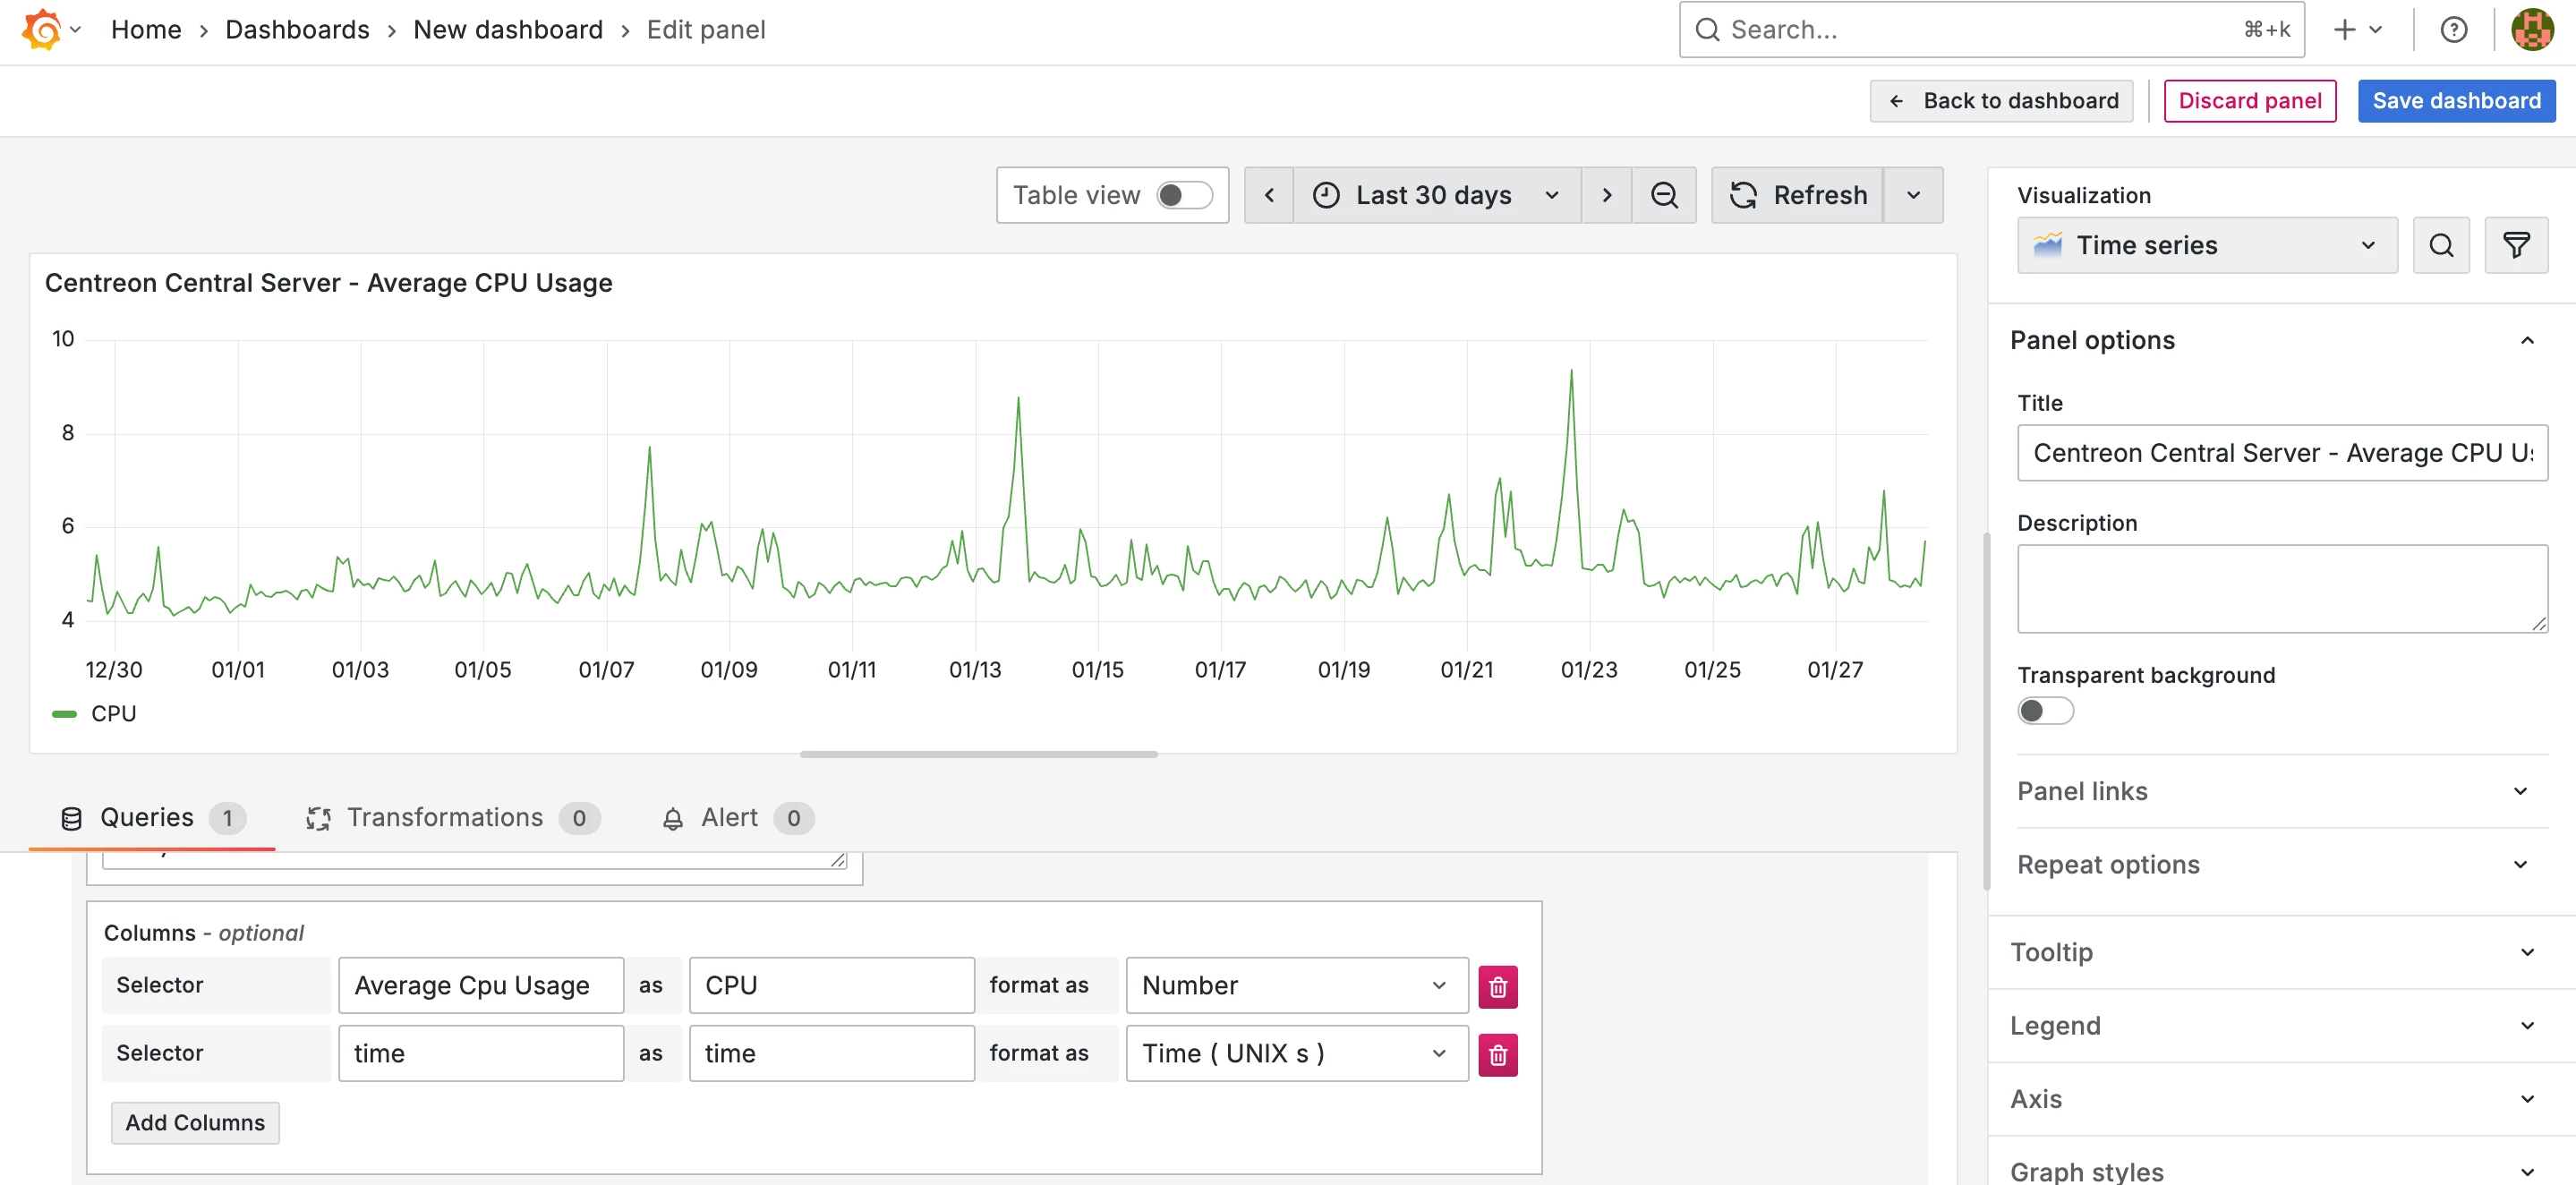
In our example, we will keep only the Average CPU Usage column, renaming it CPU, and improve the display of the dates:
To go further
Displaying the performance graph for a metaservice
For metaservices, repeat the procedure to retrieve the resource ID. The URL format will then be:
/monitoring/metaservices/<meta-service_ID>/metrics/performance
Then follow the procedure to add your first widget.
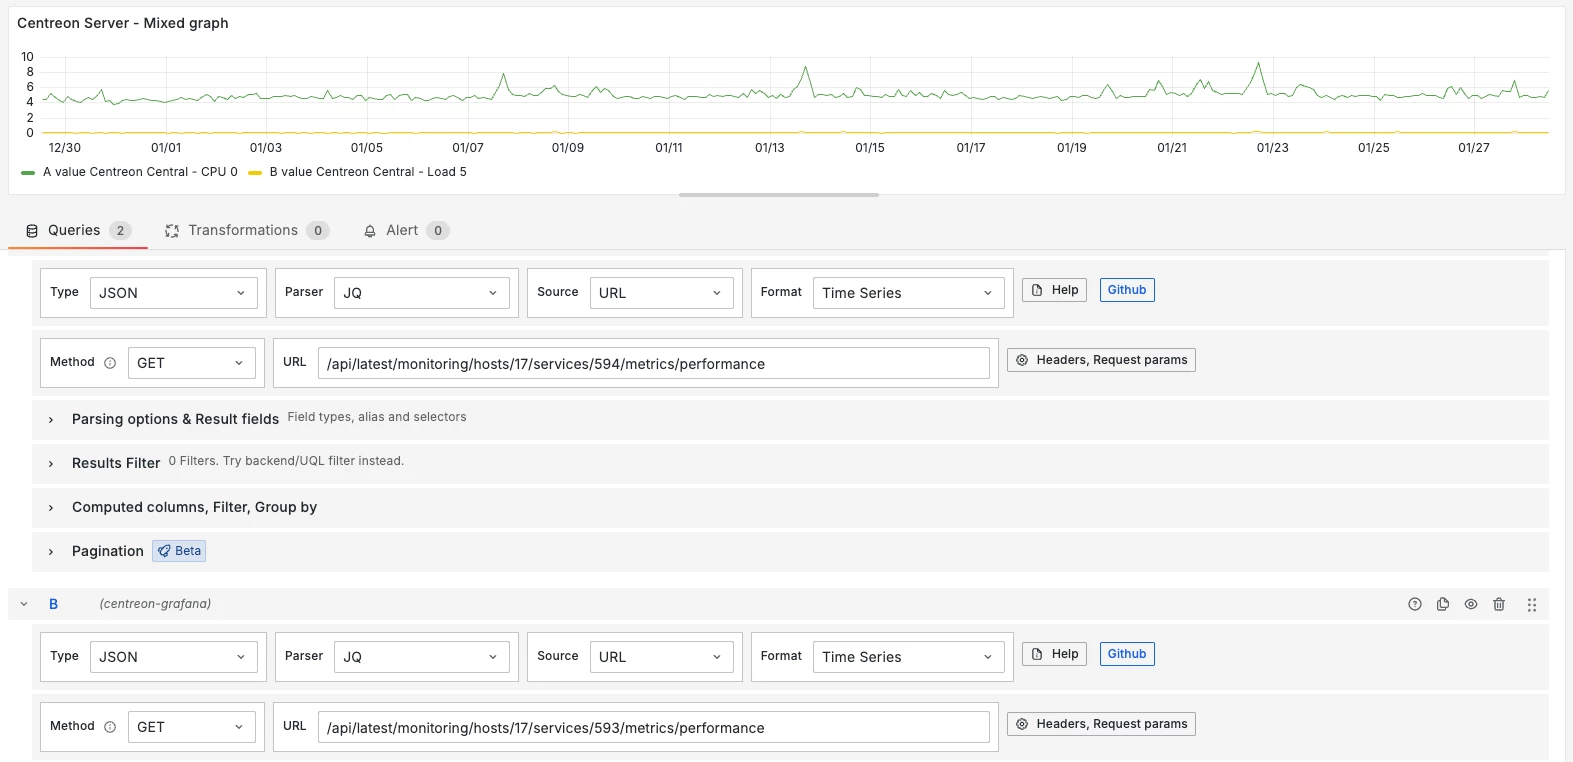
Mixing data from multiple services
To combine data from multiple services, you will need to make as many queries as necessary. For ease of use, duplicate query A and modify the IDs in the URL of query B:
Using other display formats
You can use the suggestions offered in the visualization panel or select from the following (non-exhaustive) list:
- Gauge
- Stats
- Trend
- Time Series
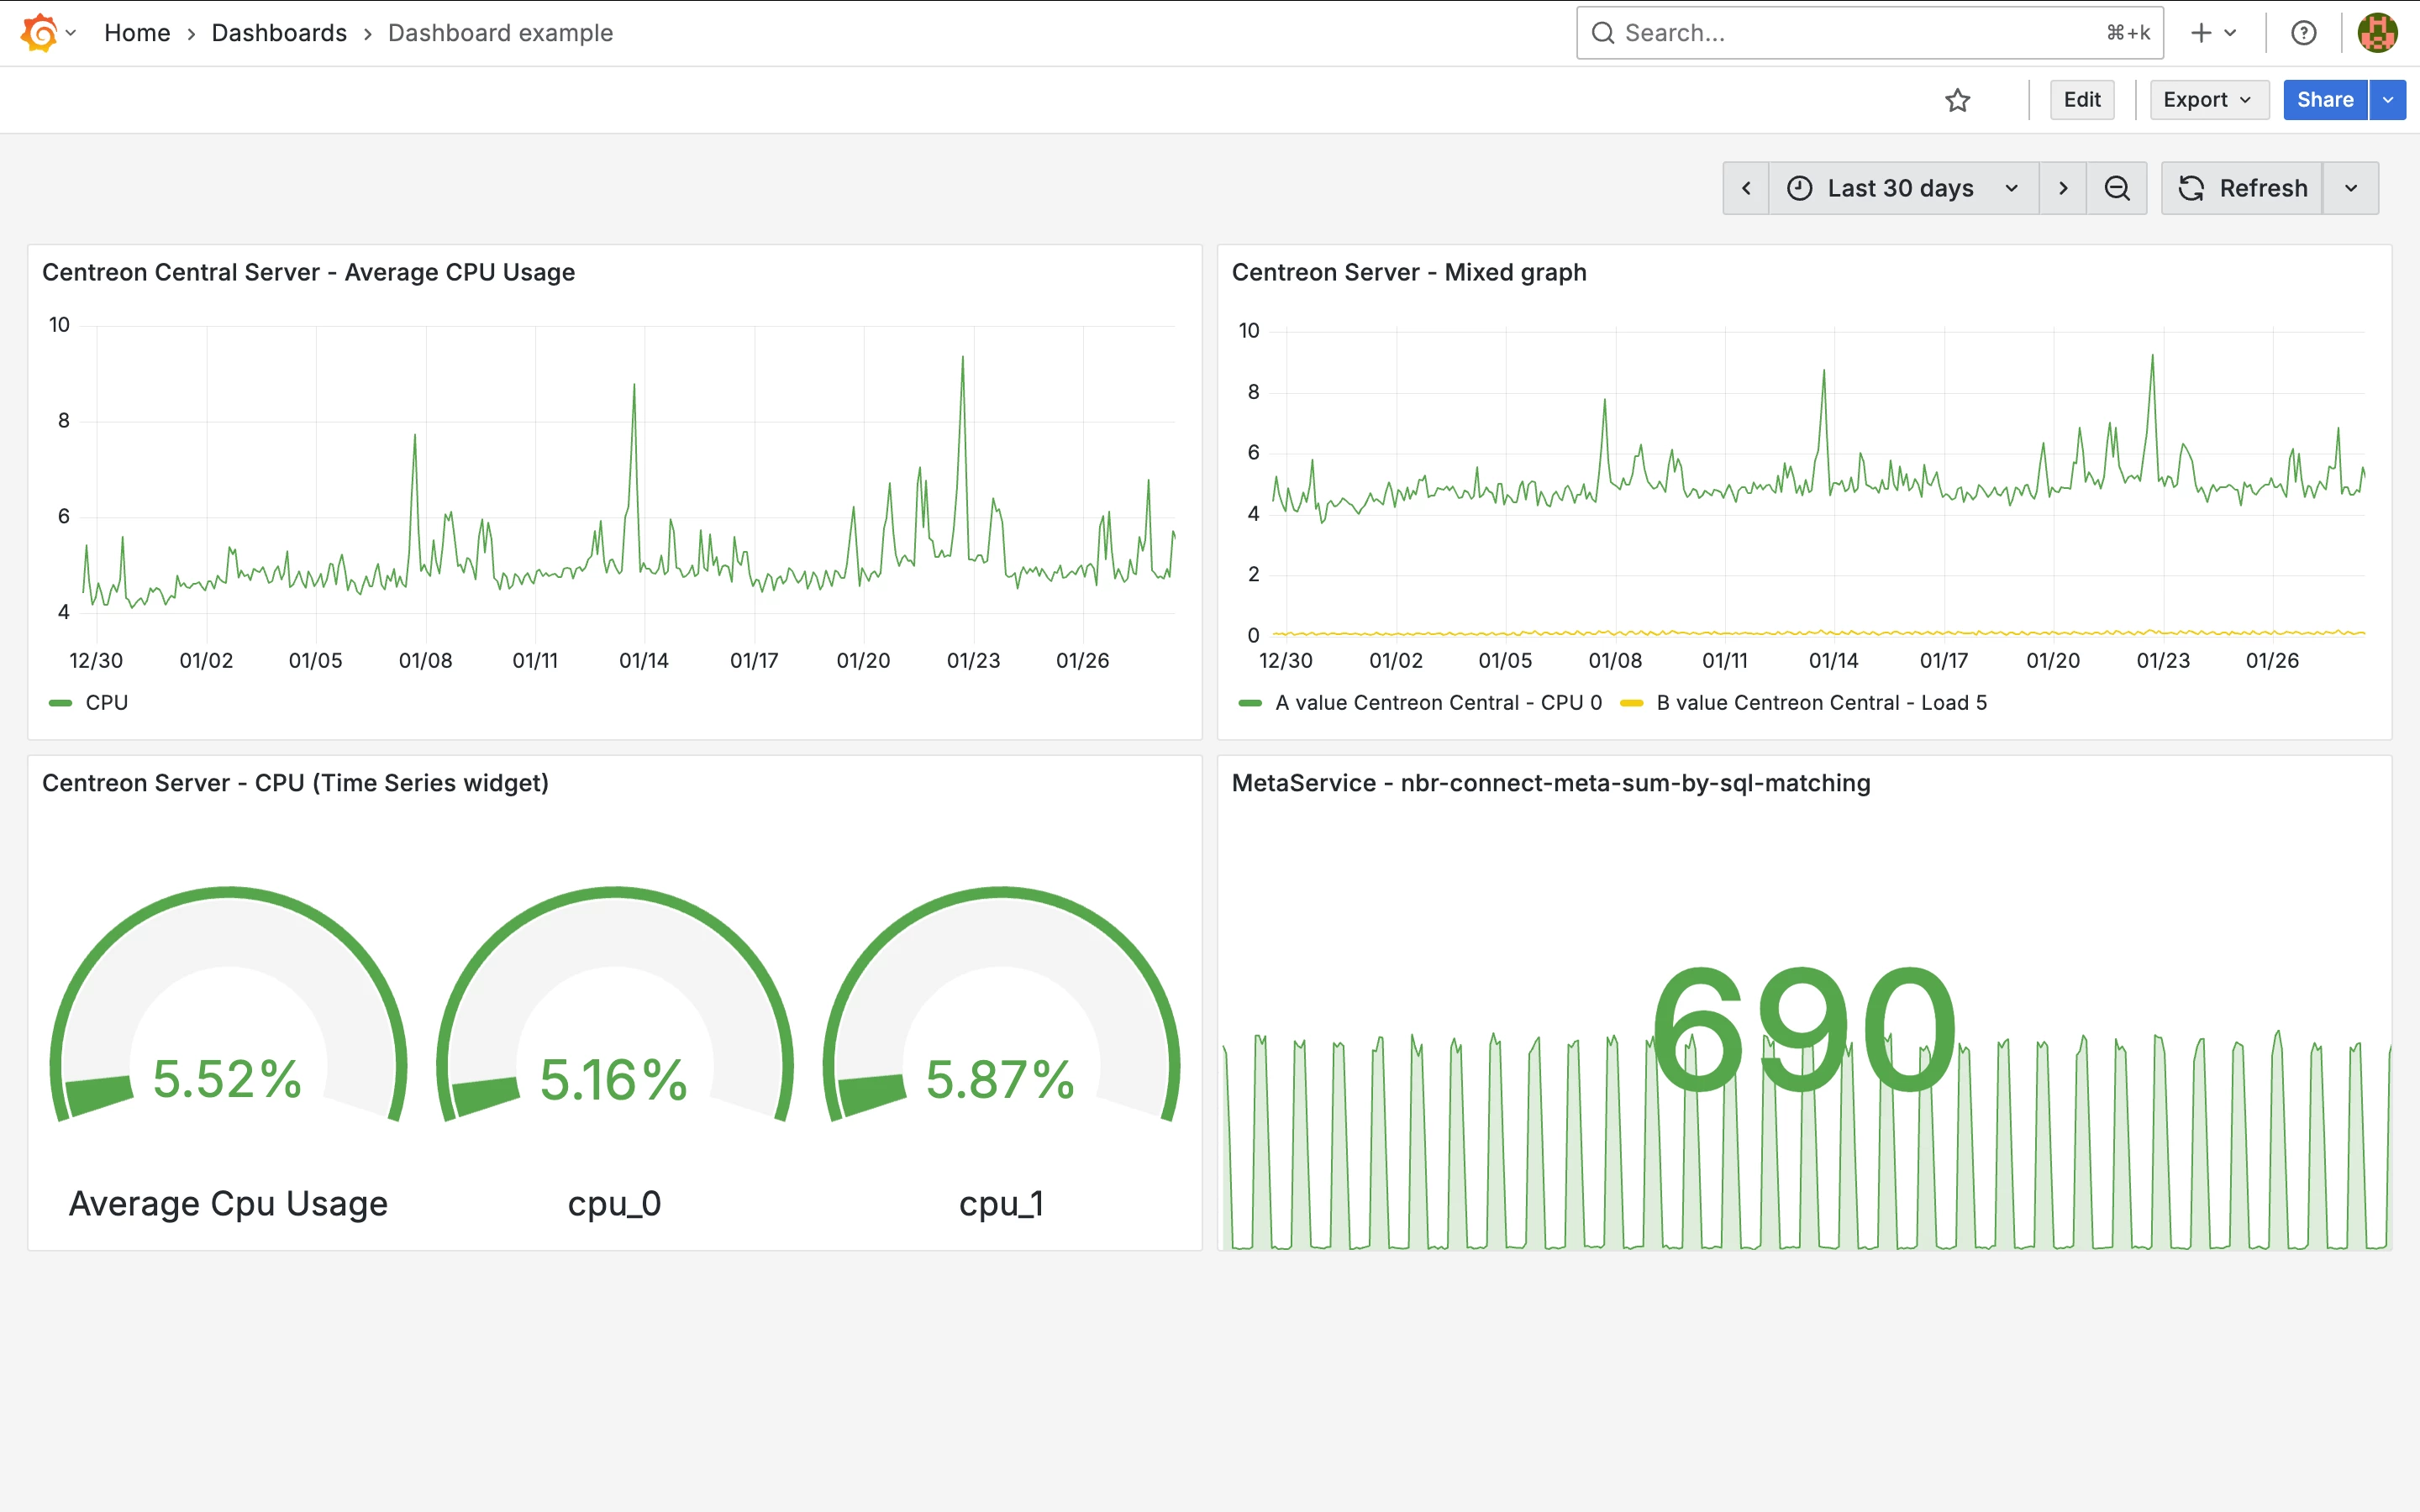
JSON export of the dashboard above:
{
"annotations": {
"list": [
{
"builtIn": 1,
"datasource": {
"type": "grafana",
"uid": "-- Grafana --"
},
"enable": true,
"hide": true,
"iconColor": "rgba(0, 211, 255, 1)",
"name": "Annotations & Alerts",
"type": "dashboard"
}
]
},
"editable": true,
"fiscalYearStartMonth": 0,
"graphTooltip": 0,
"id": 48,
"links": [],
"panels": [
{
"datasource": {
"type": "yesoreyeram-infinity-datasource",
"uid": "bfbf6bp3xkwsgc"
},
"fieldConfig": {
"defaults": {
"color": {
"mode": "palette-classic"
},
"custom": {
"axisBorderShow": false,
"axisCenteredZero": false,
"axisColorMode": "text",
"axisLabel": "",
"axisPlacement": "auto",
"barAlignment": 0,
"barWidthFactor": 0.6,
"drawStyle": "line",
"fillOpacity": 0,
"gradientMode": "none",
"hideFrom": {
"legend": false,
"tooltip": false,
"viz": false
},
"insertNulls": false,
"lineInterpolation": "linear",
"lineWidth": 1,
"pointSize": 5,
"scaleDistribution": {
"type": "linear"
},
"showPoints": "auto",
"showValues": false,
"spanNulls": false,
"stacking": {
"group": "A",
"mode": "none"
},
"thresholdsStyle": {
"mode": "off"
}
},
"mappings": [],
"thresholds": {
"mode": "absolute",
"steps": [
{
"color": "green",
"value": 0
},
{
"color": "red",
"value": 80
}
]
}
},
"overrides": []
},
"gridPos": {
"h": 8,
"w": 12,
"x": 0,
"y": 0
},
"id": 1,
"options": {
"legend": {
"calcs": [],
"displayMode": "list",
"placement": "bottom",
"showLegend": true
},
"tooltip": {
"hideZeros": false,
"mode": "single",
"sort": "none"
}
},
"pluginVersion": "12.2.1+security-01",
"targets": [
{
"columns": [
{
"selector": "Average Cpu Usage",
"text": "CPU",
"type": "number"
},
{
"selector": "time",
"text": "time",
"timestampFormat": "2006-01",
"type": "timestamp_epoch_s"
}
],
"datasource": {
"type": "yesoreyeram-infinity-datasource",
"uid": "bfbf6bp3xkwsgc"
},
"filters": [],
"format": "timeseries",
"global_query_id": "",
"parser": "jq-backend",
"refId": "A",
"root_selector": ".times as $times\n| reduce .metrics[] as $m (\n {};\n . + {\n ($m.legend): (\n $m.data\n )\n }\n )\n| to_entries\n| . as $entries\n| range(0; ($entries[0].value | length)) as $i\n| (\n {\n time: ($times[$i] | fromdateiso8601)\n }\n +\n reduce $entries[] as $e (\n {};\n . + { ($e.key): $e.value[$i] }\n )\n )",
"source": "url",
"type": "json",
"url": "/monitoring/hosts/17/services/594/metrics/performance",
"url_options": {
"data": "",
"method": "GET",
"params": [
{
"key": "start",
"value": "${__from:date:YYYY-MM-DD HH\\:mm\\:ss}"
},
{
"key": "end",
"value": "${__to:date:YYYY-MM-DD HH\\:mm\\:ss}"
}
]
}
}
],
"title": "Centreon Central Server - Average CPU Usage",
"type": "timeseries"
},
{
"datasource": {
"type": "yesoreyeram-infinity-datasource",
"uid": "bfbf6bp3xkwsgc"
},
"fieldConfig": {
"defaults": {
"color": {
"mode": "palette-classic"
},
"custom": {
"axisBorderShow": false,
"axisCenteredZero": false,
"axisColorMode": "text",
"axisLabel": "",
"axisPlacement": "auto",
"barAlignment": 0,
"barWidthFactor": 0.6,
"drawStyle": "line",
"fillOpacity": 0,
"gradientMode": "none",
"hideFrom": {
"legend": false,
"tooltip": false,
"viz": false
},
"insertNulls": false,
"lineInterpolation": "linear",
"lineWidth": 1,
"pointSize": 5,
"scaleDistribution": {
"type": "linear"
},
"showPoints": "auto",
"showValues": false,
"spanNulls": false,
"stacking": {
"group": "A",
"mode": "none"
},
"thresholdsStyle": {
"mode": "off"
}
},
"fieldMinMax": true,
"mappings": [],
"thresholds": {
"mode": "absolute",
"steps": [
{
"color": "green",
"value": 0
}
]
}
},
"overrides": []
},
"gridPos": {
"h": 8,
"w": 12,
"x": 12,
"y": 0
},
"id": 2,
"options": {
"legend": {
"calcs": [],
"displayMode": "list",
"placement": "bottom",
"showLegend": true
},
"tooltip": {
"hideZeros": false,
"mode": "single",
"sort": "none"
}
},
"pluginVersion": "12.2.1+security-01",
"targets": [
{
"columns": [
{
"selector": "metric",
"text": "",
"type": "string"
},
{
"selector": "time",
"text": "time",
"type": "timestamp_epoch"
},
{
"selector": "value",
"text": "value",
"type": "number"
}
],
"datasource": {
"type": "yesoreyeram-infinity-datasource",
"uid": "bfbf6bp3xkwsgc"
},
"filters": [],
"format": "timeseries",
"global_query_id": "",
"parser": "jq-backend",
"refId": "A",
"root_selector": "[ .times, (.metrics[] | select(.metric == \"cpu_0\") | .data) ]\n| transpose\n| map({ time: (.[0] | fromdateiso8601 * 1000), value: .[1], metric: \"Centreon Central - CPU 0\" })\n| map(select(.value != null))",
"source": "url",
"type": "json",
"url": "/monitoring/hosts/17/services/594/metrics/performance",
"url_options": {
"data": "",
"method": "GET",
"params": [
{
"key": "start",
"value": "${__from:date:YYYY-MM-DD HH\\:mm\\:ss}"
},
{
"key": "end",
"value": "${__to:date:YYYY-MM-DD HH\\:mm\\:ss}"
}
]
}
},
{
"columns": [
{
"selector": "metric",
"text": "",
"type": "string"
},
{
"selector": "time",
"text": "time",
"type": "timestamp_epoch"
},
{
"selector": "value",
"text": "value",
"type": "number"
}
],
"datasource": {
"type": "yesoreyeram-infinity-datasource",
"uid": "bfbf6bp3xkwsgc"
},
"filters": [],
"format": "timeseries",
"global_query_id": "",
"hide": false,
"parser": "jq-backend",
"refId": "B",
"root_selector": "[ .times, (.metrics[] | select(.metric == \"load5\") | .data) ]\n| transpose\n| map({ time: (.[0] | fromdateiso8601 * 1000), value: .[1], metric: \"Centreon Central - Load 5\" })\n| map(select(.value != null))",
"source": "url",
"type": "json",
"url": "/monitoring/hosts/17/services/593/metrics/performance",
"url_options": {
"data": "",
"method": "GET",
"params": [
{
"key": "start",
"value": "${__from:date:YYYY-MM-DD HH\\:mm\\:ss}"
},
{
"key": "end",
"value": "${__to:date:YYYY-MM-DD HH\\:mm\\:ss}"
}
]
}
}
],
"title": "Centreon Server - Mixed graph",
"type": "timeseries"
},
{
"datasource": {
"type": "yesoreyeram-infinity-datasource",
"uid": "bfbf6bp3xkwsgc"
},
"fieldConfig": {
"defaults": {
"color": {
"mode": "thresholds"
},
"fieldMinMax": true,
"mappings": [],
"max": 100,
"min": 0,
"thresholds": {
"mode": "absolute",
"steps": [
{
"color": "green",
"value": 0
}
]
},
"unit": "percent"
},
"overrides": []
},
"gridPos": {
"h": 8,
"w": 12,
"x": 0,
"y": 8
},
"id": 3,
"options": {
"minVizHeight": 75,
"minVizWidth": 75,
"orientation": "auto",
"reduceOptions": {
"calcs": [
"lastNotNull"
],
"fields": "",
"values": false
},
"showThresholdLabels": false,
"showThresholdMarkers": true,
"sizing": "auto"
},
"pluginVersion": "12.2.1+security-01",
"targets": [
{
"columns": [
{
"selector": "cpu_0",
"text": "",
"type": "number"
},
{
"selector": "time",
"text": "",
"type": "timestamp_epoch"
},
{
"selector": "cpu_1",
"text": "",
"type": "number"
},
{
"selector": "Average Cpu Usage",
"text": "",
"type": "number"
}
],
"datasource": {
"type": "yesoreyeram-infinity-datasource",
"uid": "bfbf6bp3xkwsgc"
},
"filters": [],
"format": "timeseries",
"global_query_id": "",
"parser": "jq-backend",
"refId": "A",
"root_selector": ".times as $times\n| reduce .metrics[] as $m (\n {};\n . + {\n ($m.legend): (\n $m.data\n )\n }\n )\n| to_entries\n| . as $entries\n| range(0; ($entries[0].value | length)) as $i\n| (\n {\n time: ($times[$i] | fromdateiso8601 | .*1000)\n }\n +\n reduce $entries[] as $e (\n {};\n . + { ($e.key): $e.value[$i] }\n )\n )",
"source": "url",
"type": "json",
"url": "/monitoring/hosts/17/services/594/metrics/performance",
"url_options": {
"data": "",
"method": "GET",
"params": [
{
"key": "start",
"value": "${__from:date:YYYY-MM-DD HH\\:mm\\:ss}"
},
{
"key": "end",
"value": "${__to:date:YYYY-MM-DD HH\\:mm\\:ss}"
}
]
}
}
],
"title": "Centreon Server - CPU (Time Series widget)",
"type": "gauge"
},
{
"datasource": {
"type": "yesoreyeram-infinity-datasource",
"uid": "bfbf6bp3xkwsgc"
},
"fieldConfig": {
"defaults": {
"color": {
"mode": "thresholds"
},
"fieldMinMax": true,
"mappings": [],
"thresholds": {
"mode": "absolute",
"steps": [
{
"color": "green",
"value": 0
}
]
}
},
"overrides": []
},
"gridPos": {
"h": 8,
"w": 12,
"x": 12,
"y": 8
},
"id": 4,
"options": {
"colorMode": "value",
"graphMode": "area",
"justifyMode": "auto",
"orientation": "auto",
"percentChangeColorMode": "standard",
"reduceOptions": {
"calcs": [
"lastNotNull"
],
"fields": "",
"values": false
},
"showPercentChange": false,
"textMode": "auto",
"wideLayout": true
},
"pluginVersion": "12.2.1+security-01",
"targets": [
{
"columns": [
{
"selector": "connection",
"text": "value",
"type": "number"
},
{
"selector": "time",
"text": "time",
"type": "timestamp_epoch"
}
],
"datasource": {
"type": "yesoreyeram-infinity-datasource",
"uid": "dfaqbt5b38ykgc"
},
"filters": [],
"format": "timeseries",
"global_query_id": "",
"parser": "jq-backend",
"refId": "A",
"root_selector": ".times as $times\n| reduce .metrics[] as $m (\n {};\n . + {\n ($m.legend): (\n $m.data\n )\n }\n )\n| to_entries\n| . as $entries\n| range(0; ($entries[0].value | length)) as $i\n| (\n {\n time: ($times[$i] | fromdateiso8601 | .*1000)\n }\n +\n reduce $entries[] as $e (\n {};\n . + { ($e.key): $e.value[$i] }\n )\n )",
"source": "url",
"type": "json",
"url": "/monitoring/metaservices/2/metrics/performance",
"url_options": {
"data": "",
"method": "GET",
"params": [
{
"key": "start",
"value": "${__from:date:YYYY-MM-DD HH\\:mm\\:ss}"
},
{
"key": "end",
"value": "${__to:date:YYYY-MM-DD HH\\:mm\\:ss}"
}
]
}
}
],
"title": "MetaService - nbr-connect-meta-sum-by-sql-matching",
"type": "stat"
}
],
"preload": false,
"schemaVersion": 42,
"tags": [],
"templating": {
"list": []
},
"time": {
"from": "now-30d",
"to": "now"
},
"timepicker": {},
"timezone": "browser",
"title": "Dashboard example",
"uid": "adfrwrl",
"version": 2
}

