Solved

SNMP TRAP is pending until trap is sent

  • 18 January 2024
  • 42 replies
  • 307 views

Badge +4

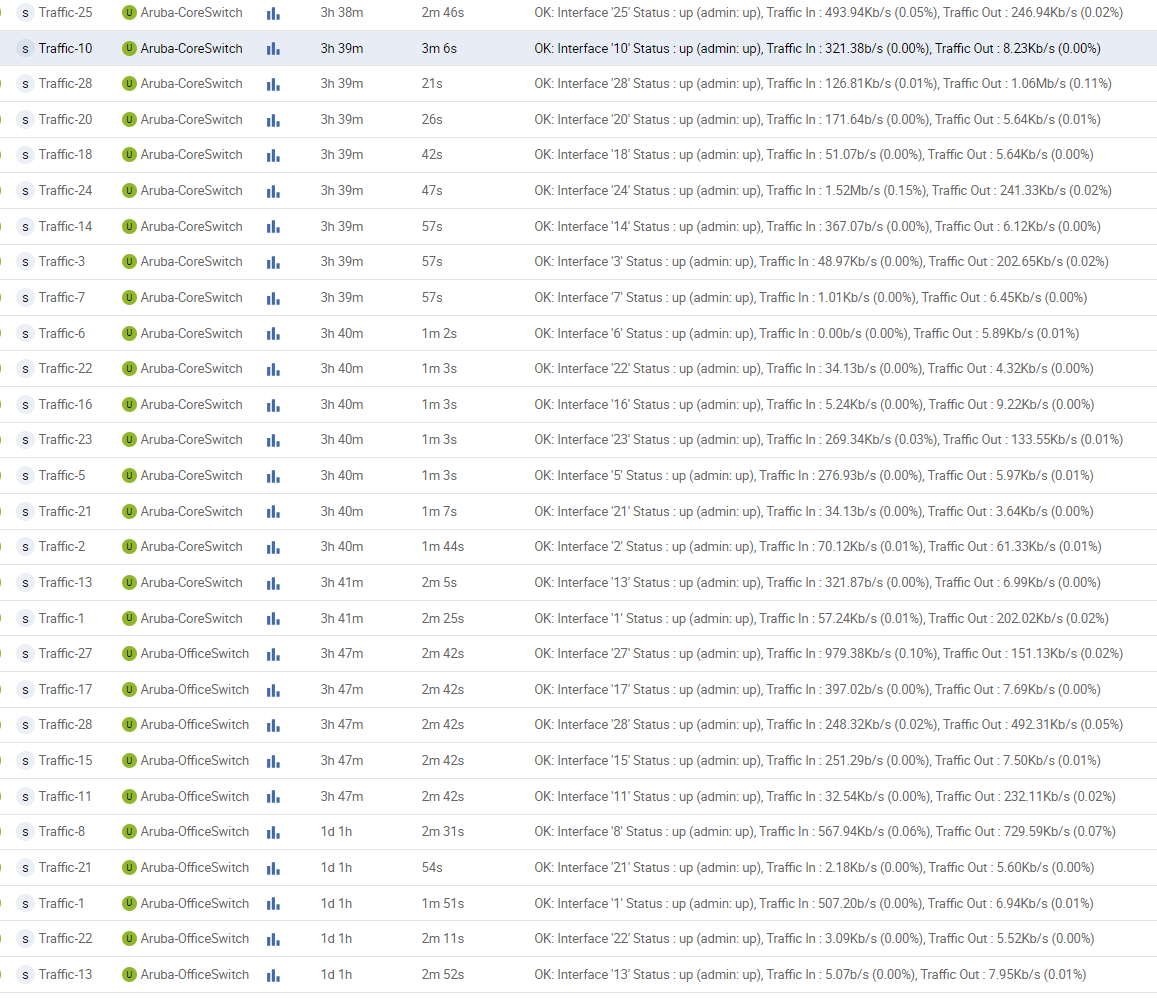
I don't know if this is normal, but the services to which SNMP traps are connected remain pending until the traps are sent from the device. I have triggered the traps manually. After that everything works perfectly, the services go into the critical state and then into the OK state and stay there until a trap is sent again.

icon

Best answer by vcoum 18 January 2024, 14:29

View original

42 replies

Userlevel 5
Badge +11

Yes it’s inherited from the parent template, so hosts inherits from host templates, and services inherits from service templates


For notification it’s a bit different because there is an option to inherit the contacts to notify from the parent host

But AFAIK, for scheduling, it’s only service from service templates 

What you can do is to create a service template with your scheduling option and apply it to your other service templates

Badge +4

But if I understand it the right way Commands are inherited by services from their host. I come to this conclusion because I have defined snmpv3 in the EXTRAOPTION-Macro of my host-template. My services get the right values. 

Badge +4

“What you can do is to create a service template with your scheduling option and apply it to your other service templates”

How do you do this? 

It says (Using service templates | Centreon Documentation): “A service or a service template can only inherit from a single service template (parent-child type inheritance).”

Userlevel 5
Badge +11

No, the command are not inherited from their host, but by the service template

You got the right value because the command the service uses have a host macro

For exemple, this is Linux SNMP CPU command

centreon_linux_snmp.pl --plugin=os::linux::snmp::plugin --mode=cpu --hostname=$HOSTADDRESS$ --snmp-version='$_HOSTSNMPVERSION$' --snmp-community='$_HOSTSNMPCOMMUNITY$' $_HOSTSNMPEXTRAOPTIONS$ --warning-average='$_SERVICEWARNING$' --critical-average='$_SERVICECRITICAL$' $_SERVICEEXTRAOPTIONS$

The command is set on the service, but some values are set on the host ($HOSTADDRESS$ for example)

When Centreon execute this command, it will automatically get the value from the service’s parent host, like address or custom macro values

Userlevel 5
Badge +11

Your services uses the templates you created, right?

You are right, service can only use one template

But what you can do is apply the “schedule” template to the templates you created, so your services template will inherite the schedule values, so your services will get the schedule values too


Schedule Template → RealTemplate → Service

I don’t know if it’s clear 😅

Badge +4

I understand. Thank you

Badge +4

But I hope I am right with this assumption. I have Cumulative Inheritance activated. So therefore my contact and notification settings are inherited by my services from my host-template. Is this right because I can not make sense out of this descirption: Cumulate all contacts and contactgroups of resources and linked templates (method used for new installation).


Userlevel 5
Badge +11

I think you’re right, if we read the doc we have this info


Badge +4

Do you have an idea how to contact centreon support? Because my aruba switch problem still stands and it has to be a centreon bug. Under support.centreon.com is not option to open a ticket.

Userlevel 5
Badge +11

No sorry

Badge +4

Hello @vcoum,

I would like to ask two things. Do you know how I can change the color of the lines in the graph?


Badge +4

And in this picture, you can see no linked contacts of a service. But I linked a service to the host template and I even get notifications for this service. Is this a bug that it says “No contacts are configured for this resource”?

Thank you very much

Userlevel 5
Badge +11

Hello @query 

For the first thing, go to Monitoring > Performances > Curves on Centreon UI

Then add a curve for each metrics you want to edit the color (in your case 4)

In Data Source Name you need to write the metric label

Save, et and check if your curve has the new color


For the second thing, i guess it’s a bug and the view doesn’t show inherited contact

For this you should open a new topic on thewatch

Hope it helps


Badge +4

The colors of the graph changed. Perfect


Badge +4

Hello @vcoum,

I am unsure about the rates of traffic I get for my interfaces on my switch. In the picture you can see that the incoming traffic remains under 1 Megabit/s. But I got  an internet speed of much more than 1 Megabit/s. 


Badge +4

Hello @vcoum,

Can you help me with two questions?

My first question is: Why are some services listed as choice and others are not listed as choice in the dashboard? This happens when I select the “Select resource” option in the picture.

My second question, is it possible to get more than 11 interfaces into the explanation of curves under the graph (picture 2)

Thank you very much for your help

Userlevel 5
Badge +11

Hello @query 

For the first question i’m not sure, maybe some services doen’t have metrics? That could explain why they don’t show up on the list


Second question, yes i think it’s possible, i have some graph with more than 11 metrics (well it’s not very ligible but it works)


Reply