

Always with the intent to provide the most flexible monitoring possible and let the user choose what kind of monitoring fits its needs in terms of deployment, customization, and security, we continue to leverage Prometheus & Node Exporter capabilities.
What’s new?
Target Discovery
When working with DevOps teams, they often set up a Prometheus to watch over metrics generated by their applications and orchestrators instrumenting it during the whole deployment lifecycle.
The Prometheus targets can now be discovered and mapped to a host in Centreon, and you can leverage labels to apply the right template or organize your configuration (Groups, Categories) thanks to the Host Discovery mappers.
Windows Monitoring
The Prometheus community is maintaining a Windows Exporter that let you easily deploy a lightweight exporter to monitor basic and more advanced Windows systems and apps’ metrics.
When comparing this solution against existing NSClient++ or WSMan, here is what you should keep in mind:
-
doesn’t allow to run of custom scripts
-
enable user-friendly Windows network interface monitoring
-
is easier to deploy
-
leverage Windows performance counters by design, therefore, could provide code-level monitoring of .NET applications
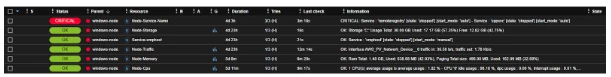
The Pack comes with service discovery rules to make your deployment faster. Regarding metrics, we only implemented the default ones:
If you’re interested in some more specific metrics from this list, just drop a comment below and we’ll add them to our backlog.