Hello,First of all, thank you if you can correct me if it is not the right subforum and thank you in advance for any help.
INTRODUCTION
I am deploying a platform from scratch that includes:- Central server- Poller server 1- Poller server 2
By this I mean that all repositories, etc. They are updated to the latest.They are all mounted on RHEL9.2 and the Centreon version is 23.10. Everything is deployed according to the documentation, and there are currently several hosts already successfully monitored.
Now, I am deploying monitoring for one of my VCSAs via restAPI (vSphere Client version 7.0.3.01700) as per the documentationhttps://docs.centreon.com/pp/integrations/plugin-packs/procedures/applications-vmware-vcsa-restapi/*Indicate that I already have the monitoring of my ESX hosts of that same VCSA correctly deployed according to the documentation https://docs.centreon.com/pp/integrations/plugin-packs/procedures/virtualization-vmware2-esx/
I have a license acquired from Centreon. Could I open a ticket directly to support with this?
PROBLEM
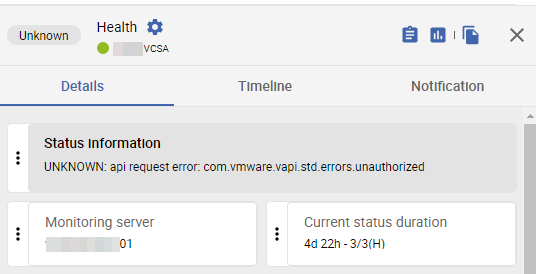
When monitoring the VCSA, I get the following in the health service: UNKNOWN: api request error: com.vmware.vapi.std.errors.unauthorized

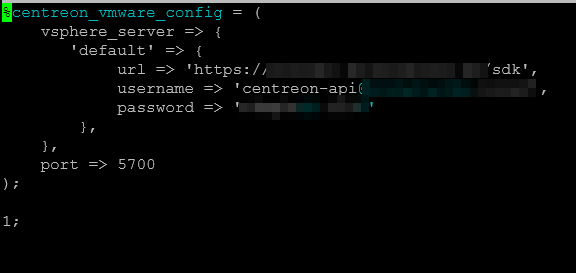
Apparently, the API user I use is correct at the permissions level, since it is the same one I use to monitor the ESX and the same one defined in the centeron_vmware.pm file (I share it below).At the communication level, 443 and 5700 traffic is allowed. My communications equipment sees round trip traffic between my Poller server and the VCSA.In fact, if I run the following command, I get a positive response:
curl -X GET https://kloudvc.**********.es/api/vapi/metadata/authentication/component -H 'vmware-api-session-id: **************'
["com.vmware.vcenter.ovf","com.vmware.oauth2","com.vmware.vstats","tokenservice","com.vmware.cis","com.vmware.vcenter.inventory","com.vmware.appliance.vmon","com.vmware.vcenter.vm.compute","com.vmware.vcenter","com.vmware.vcenter.compute","com.vmware.vapi.vcenter","com.vmware.vcenter.lcm","com.vmware.vcenter.hvc","com.vmware.vcenter.namespaces","com.vmware.cis.tagging","cis","activedirectory","hcl","com.vmware.cis.authz","com.vmware.vcenter.content.registries","com.vmware.transfer","com.vmware.appliance.recovery","com.vmware.hlm","com.vmware.vapi","settings","com.vmware.vcenter.stats.topn","com.vmware.appliance.vcenter.settings.v1","hosts","health","svcaccountmgmt","com.vmware.appliance.infraprofile","com.vmware.vcenter.authentication","com.vmware.vcenter.vm_template","com.vmware.vcenter.namespace_management","com.vmware.content","com.vmware.appliance.observability","com.vmware.remote_appliances","com.vmware.cis.data","com.vmware.appliance","com.vmware.vapi.rest.navigation","com.vmware.vcenter.iso","com.vmware.cis.license.subscr
Additional information
/usr/lib/centreon/plugins//centreon_vmware_vcsa_restapi.pl
--plugin=apps::vmware::vcsa::restapi::plugin
--mode=health
--hostname=kloudvc.kionetworks.es
--api-username='centreon-api@******.*****'
--api-password='*********'
--port='443'
--proto='https'
--filter-service=''
--unknown-status=''
--warning-status=''
--critical-status='%{health} !~ /green/'
--verbose
/etc/centreon/centreon_vmware.pm

This check to monitor the ESXI within the VCSA, which gives me an error as I said, works correctly and its parameterization is as follows:
/usr/lib/centreon/plugins//centreon_vmware_connector_client.pl
--plugin=apps::vmware::connector::plugin
--mode=cpu-host
--custommode=connector
--connector-hostname='localhost'
--connector-port='5700'
--container='default'
--verbose
--esx-hostname='fmuesxi*****01.******.es'
--unknown-status='%{status} !~ /^connected$/i'
--warning-status=''
--critical-status=''
--warning-total-cpu=''
--critical-total-cpu=''
--warning-total-cpu-mhz=''
--critical-total-cpu-mhz=''
--warning-cpu=''
--critical-cpu=''


