Hello,For the past few days, I've been looking into using Centreon to monitor my IT infrastructure.I installed Centreon 24.10.7 on a VM, then a few hosts and services.My Windows servers are being monitored, butI'm struggling with how to view the status of the disks in a Qnap NAS.I'm monitoring the volumes, but I haven't figured out where to tell Centreon how to check the NAS disks to be notified if they're faulty.Thank you for your help.Eric
hello
if you have used the templates from centreon for your qnap with snmp, there should be a service called “hardware-global”

and in that detailed information you can see all the hardware
Hello Christophe,Thank you for your reply. I'm struggling a bit, I admit. Here's the status of the resources I'm monitoring, but I can't figure out where to extract the status of the disks making up my Qnap NAS.Thank you for your patience.

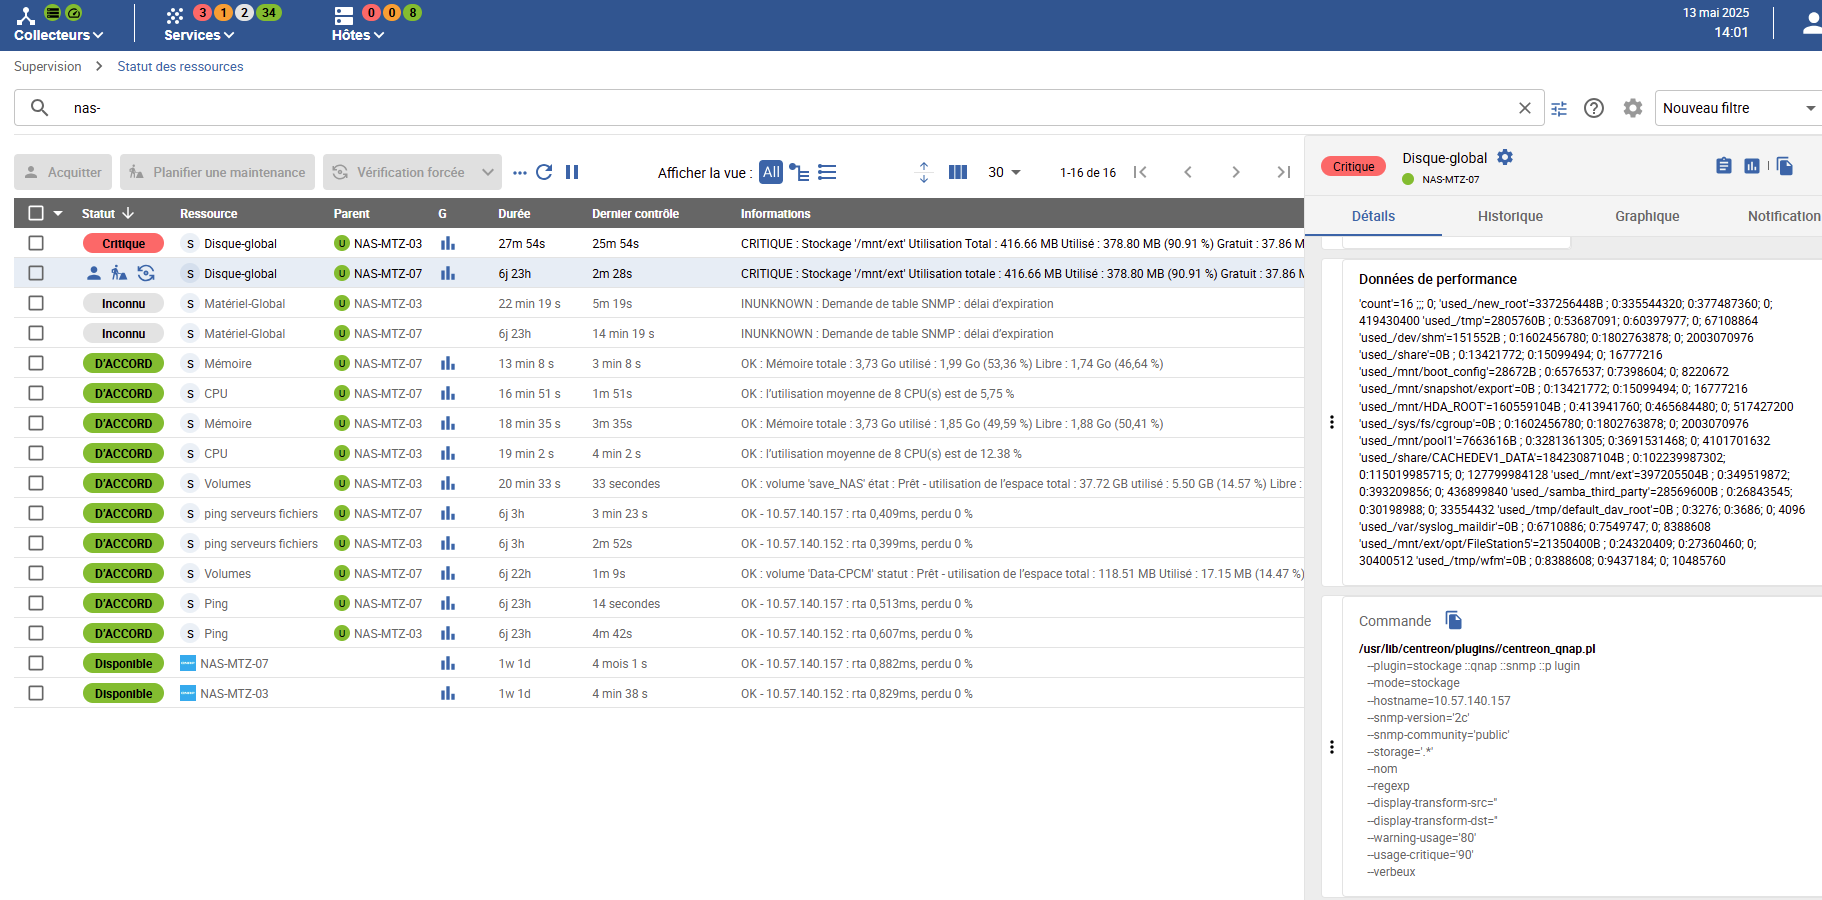
I guess you have the translation in the browser, “materiel global” is the check “hardware-global”
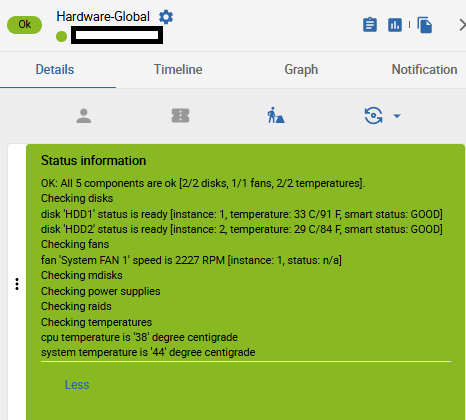
it should return the disk status like on my screenshot
you won’t get any “mapping” information, that is not provided by snmp on the qnap, so you have a critical partition because it is consumming more than 90% of the total space
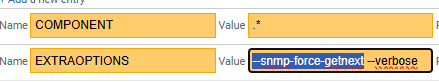
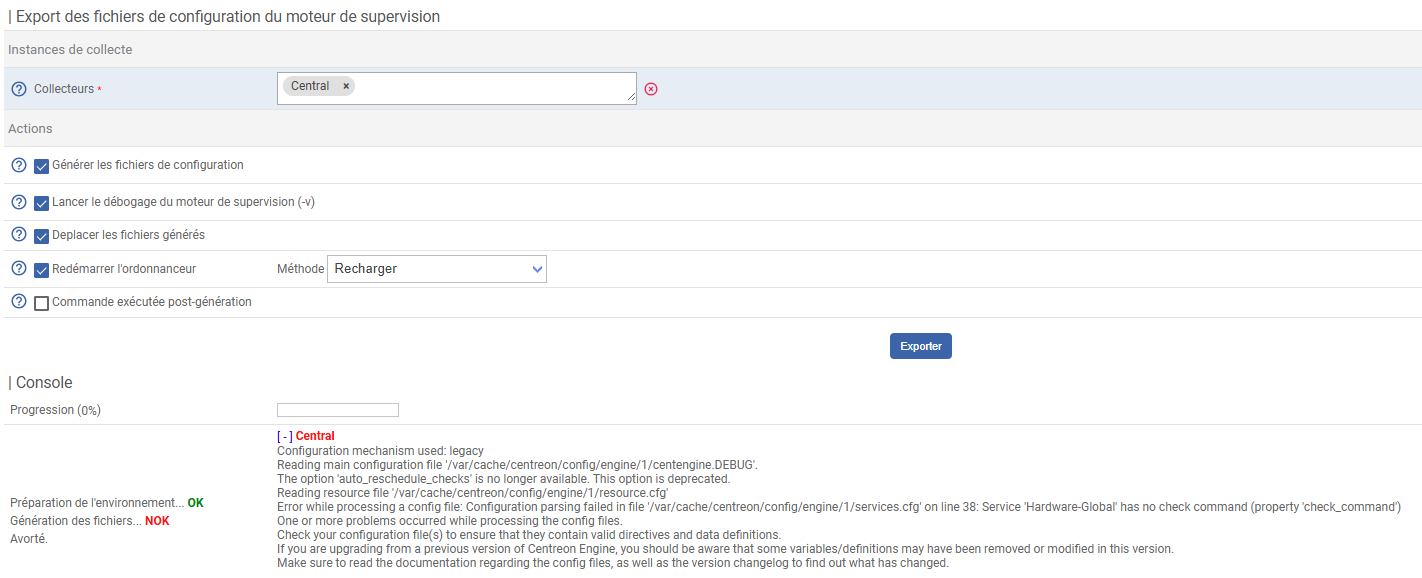
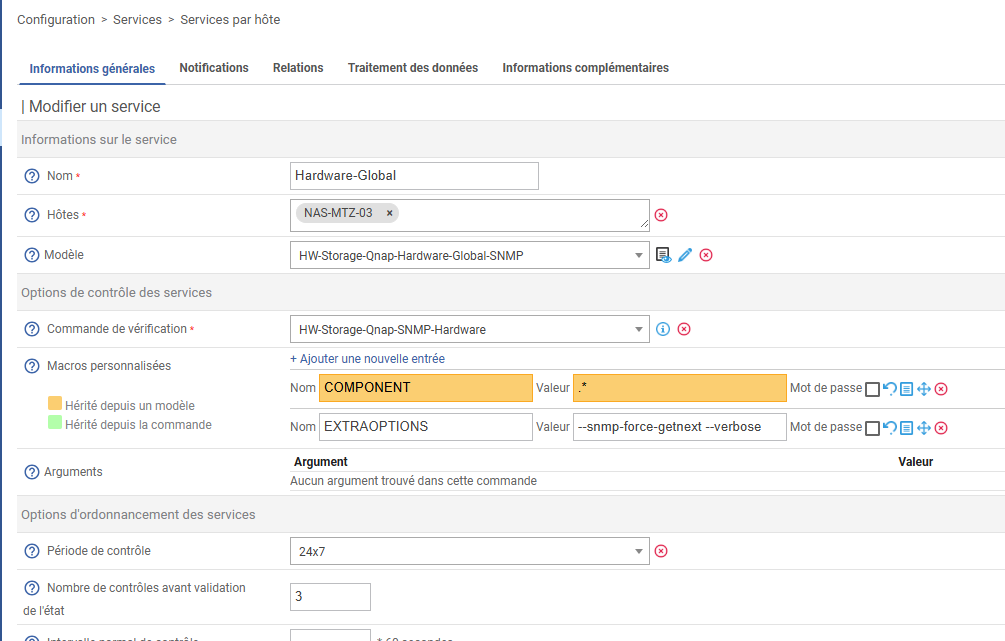
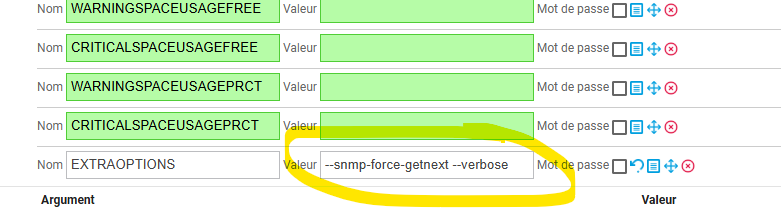
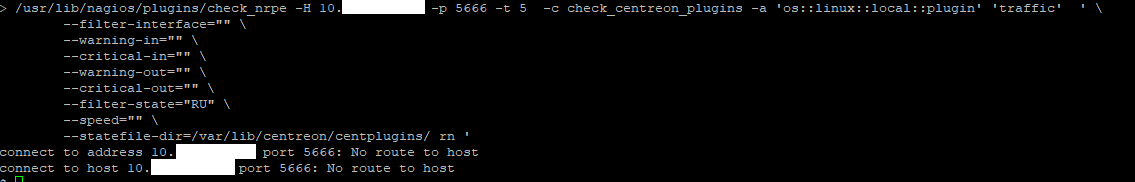
for the “timeout” on the hardware, I suggest you add --snmp-fore-getnext in the snmp extraoption on the service, this should fix the timeout issue

next, the “disk” check, this is different from the volume check and is not the physical disk, but the “disk” as they are returned by the linux os, it’s in fact all the partitions of all the file systems in the QNAP
you may be ok with just using the “Volumes” service, wich tell you wich disk number are used, the status, type of raid and disk usage, maybe you don’t need the “disk-global” check
I don’t like using the “disk-global”, as it is confusing because all is mixed in a single, you should “discover” your partition individually
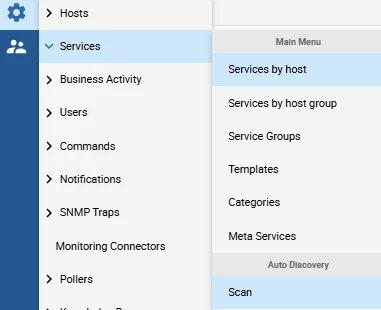
go in the service/scan menu

input your hostname, and select the qnap-snmp-disk-name, then clic scan

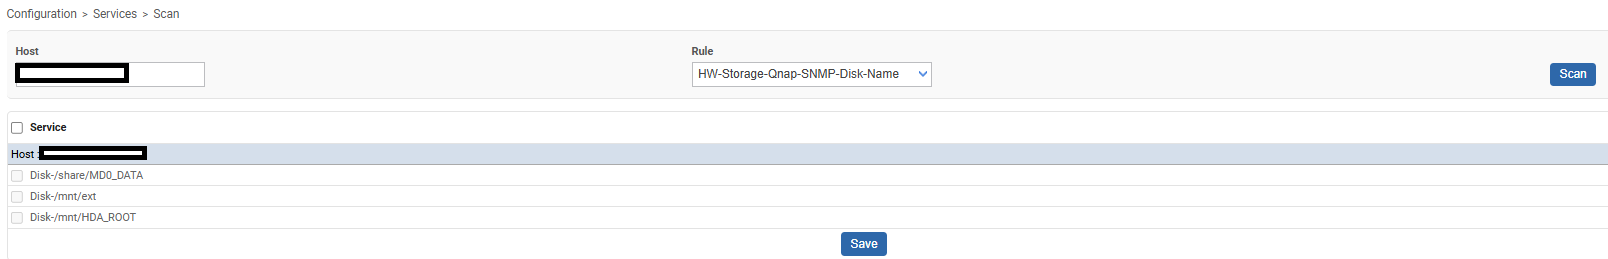
check all the boxes and save.
some of the partitions are for the qnap system, and some partition will match the volume with your data
you can check based on the size and simply disable the individual services you don’t need (like /ext or /hdaroot)
Hello Christophe,By modifying as indicated, exporting the monitoring engine configuration files returns errors.

Thanks for your help.Eric

Hello Christophe,I just understood my mistake thanks to your instructions.Thank you again for your help.
Eric
Hello Christophe,When entering this syntax, it seems there's an error.Thank you for your help.

hello
can"t help you more without the error
also, try to copy the command from the ressource detail panel, paste the command in the ssh shell then tune it until it works or not
that “--snmp-force-getnext” is optional, try running the command without, but I had to use that option on qnap because I was getting timeout without it.
I'm confused, but I don't see what I need to enter from the host to supervise.
Should I copy the "check_nrpe" file to the host to be monitored?

Clic the blue button above your yellow circle, right of "commande"
That will copy the full command
Open the ssh shell on the poller, and paste the command to run it
Screenshot the result
I don't know if this is a good idea, but I created a command by copying the proposed syntax as follows

then I mentioned it in supervision

Well
It's not question of good or bad idea.... it is the process to debug, and it is the exact command generated by centreon. That is the only way to see what really happens.
I just figured it out :-),I must be missing the "check_nrpe" file.


I will authorize ssh flows between these 2 servers
hmm
you need to be able to communicate, not ssh but nrpe (tcp 5666), you need to have a network route, and firewall rules between the poller and the host to monitor
you need the plugin, follow the documentation exactly, you have a “connector” and a “plugin” (the connector is the thing that adds the templates in the web ui on the central, the plugin is a package to install on each pollers (central can be a poller), that why you have 2 thing to install
Hello Christophe,While going through the entire procedure again, I noticed an error:

d’autre part, le connecteur de monitoring est installé sur la console Centreon


the “PACK” = the thing you install on the central to have the “template” in the web ui, this is only done once on the central
the “PLUGIN” = the thing you install on the poller (can be the same machine as the cental server) , if you have multiple pollers you will need to install that on each pollers
the pack is coming from the repository you need to add with your IT-100 licence
the plugin is coming from the public repository
is your “monitoring” machine just a poller or is it your central server?
edit : if you have the connector in the page as you added while I was responding, then the “Pack” is already installed on the central, no need to install it again
my monitoring PC is my central server
I still have an error with my iSCSI link monitoring service. I'm testing for a file on /mnt/save_bali/test.txt

when connecting as "centreon-engine", the test command does not return any value or indication

by correcting the command syntax, "no route to host" port 5666

On the other hand, the "base-ping-LAN-custom" service works perfectly. This allows me to test the presence of the machine on the network
can you do “ping 10.x.x.x” and “telnet 10.x.x.x 5666” (if telnet is not installed, there is an alternative with nc, or install telnet on the poller)
if ping works and telnet is not connecting, then :
the nrpe daemon is not working on the host 10.xxx
or there is a firewall blocking the traffic (on the linux host, or between the poller and host)
Reply
Login to the community
No account yet? Create an account
Enter your E-mail address. We'll send you an e-mail with instructions to reset your password.