Solved

Monitor an electric generator with modbus

  • 3 March 2022
  • 8 replies
  • 295 views

Badge +2

Hi,

I have need monitor an electric generator with modbus, my problem is i can't create warning threshold and critical threshold  for monitor the voltage of the battery, EDF and others components such as water temperature of motor, pression oil, temeratur oil...

On the script comment, i have informations :

    --warning-*
            Warning threshold (can be 'unique' or 'global') (Override config
            if set)

    --critical-*
            Critical threshold (can be 'unique' or 'global') (Override
            config if set)

I not anderstand this information, wished for have threshold warning at 270 and seuil critical at 265...


Other problem, i can't format return value. ex: value return 275, return value wished 27,5.

Commande execut on centreon :

./centreon_plugins.pl --plugin=apps/protocols/modbus/plugin.pm --mode=numeric-value --tcp-host=172.xxx.xxx.220 --config=hostline/modbus_group_battery.json --verbose

Plugin modbus execut with config file json :
{
    "selection":{
        "battery_charge_tension":{
            "address": 1029,
            "quantity": 1,
            "type": "holding",
            "display": true,
            "formatting": {
                "printf_msg": "Metric '%s' value is '%.2f'",
                "printf_var": "$self->{result_values}->{instance}, $self->{result_values}->{value}"
            }
        }
    }
}

Please help.

Best Regard

icon

Best answer by christophe.niel-ACT 3 March 2022, 14:17

View original

8 replies

Userlevel 5
Badge +14

look at this “old” post on the git

[Modbus Plugin] Perf Data format · Issue #939 · centreon/centreon-plugins · GitHub

basically you need a “virtualcurve” to setup your perfdata so in your json you have the “selection” part

and the virtual curve includes the critical threshold.

so you need to add something like that

{
    "selection":{
        "batteryTension":{
            "address": 1029,
            "quantity": 1,
            "type": "holding",
            "display": true,
            }
        },

        "virtualcurve": {

             "batteryTension": {

                 "unit": "V",

                 "aggregation": "avg"

          }

    }
}

you could then try to either add “ "critical": "220:"  ” below aggregation to get a threshold critical at 110 (whatever the value is)

or you can try to add “ --critical-global-batteryTension

you could also add “ "custom": "/ 10" ” below aggregation to divide the metric by 10 if you need to divide the metric


be aware of the “_” and the “-” in the metric name, it can be problematic sometime

I’m not sure if the custom property works, i don’t really have modbus anymore to test, but it worked somewhat when I was putting the critical value inside the virtual curve and not on command line


@centreon (or anyone reading) the plugin page for the modbus links to a 404 error 

Modbus | Centreon Documentation => Page not found · GitHub · GitHub (there was a doc, in github, apparently it’s gone)

Userlevel 3
Badge +4

Hello @christophe.niel-ACT,

Looks like there is a typo in the URL. The correct URL is this one:
https://github.com/centreon/centreon-plugins/blob/master/doc/en/user/guide.rst#modbus-protocol

Regards,

cg-tw

Badge +2

Hi,

Thank you very much christophe.niel-ACT and
cg-tw for your help, I can now monitor my generator, here is my feedback:

I create a configuration file with the information from the post, and I create 2 others virtualcurve to have the metric consumption in Watt and % load for each phase, see below my config file json :

(value return modbus : 1530 => 15.3A)
{
    "selection":{
        "generatorCourantPhase1":{
            "address": 1045,
            "quantity": 1,
            "display": false
        }
    },
    "virtualcurve": {
        "generatorCourantPhase1": {
            "unit": "A",
            "aggregation": "avg",
            "custom": "/10",
            "warning": "45",
            "critical": "50",
            "formatting": {
                "printf_msg": "Metric '%s' value is %.2fA",
                "printf_var": "$self->{result_values}->{instance}, $self->{result_values}->{value}"
            }
       },
        "generatorPuissancePhase1": {
            "unit": "W",
            "aggregation": "avg",
            "custom": "/10*230/1000",
            "formatting": {
                "printf_msg": "Metric '%s' value is %.2fKW",
                "printf_var": "$self->{result_values}->{instance}, $self->{result_values}->{value}"
            }
       },
        "generatorLoadPhase1": {
            "unit": "%",
            "aggregation": "avg",
            "custom": "*83/60/10",
            "formatting": {
                "printf_msg": "Metric '%s' value is %.2f%%",
                "printf_var": "$self->{result_values}->{instance}, $self->{result_values}->{value}"
            }
       }
    }
}


Result on centreon command line :

OK: Global metrics are OK | 'generatorCourantPhase1'=15.3A;0:45;0:50;; 'generatorLoadPhase1'=21.165%;;;; 'generatorPuissancePhase1'=3.519W;;;;
Metric 'generatorCourantPhase1' value is 15.30A # (calcul : value /10 => 1530/10 = 15.3A)
Metric 'generatorLoadPhase1' value is 21.16% # (calcul : value 15.3A => /10*83/60 = 21.16%) factor of load generator 83% and 60A/phase
Metric 'generatorPuissancePhase1' value is 3.52KW # (calcul : value 15.3A => /10*230/1000 = 3.52KW) 3520W => 3.5KW


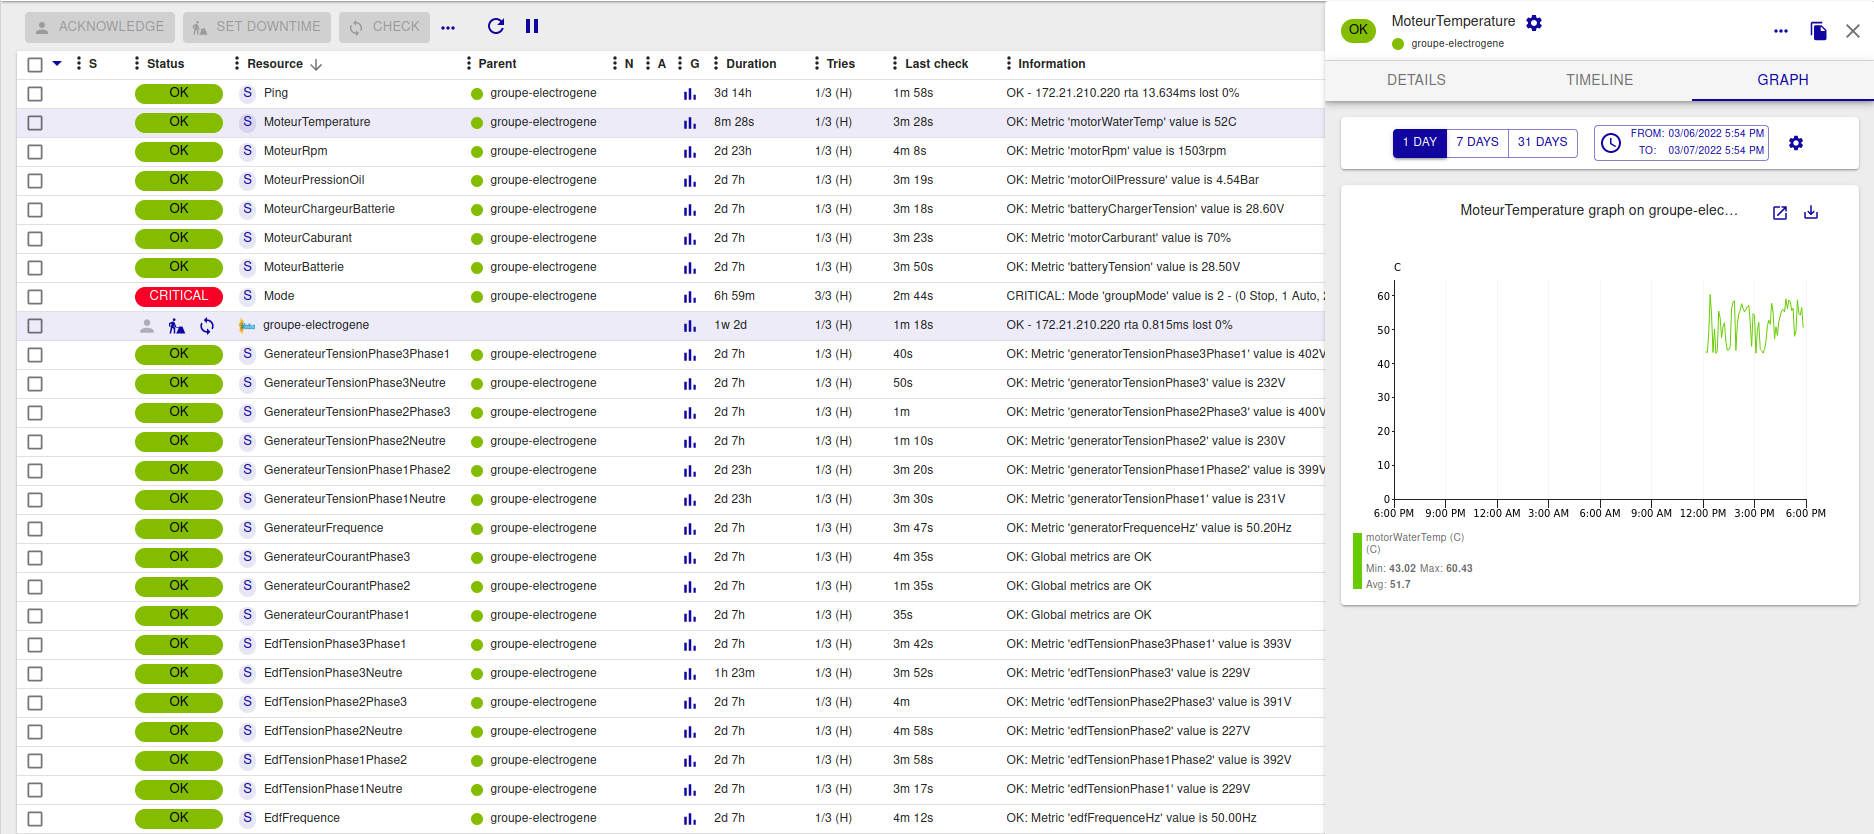
On the other hand I did not find to have my 3 phases of voltage a monitoring and also the temperature, oil pressure, rpm of the engine on another monitoring, of the blow I had to create for the moment a monitoring by type see below:

Config file motor temperature :
(value return modbus : 56 => 56C)
{
   "selection": {
      "motorWaterTemp": {
          "address": 1025,
          "quantity": 1,
          "display": false
      }
   },
   "virtualcurve": {
      "motorWaterTemp": {
         "unit": "C",
         "aggregation": "avg",
         "warning": "55:95",
         "critical": "50:100",
         "formatting": {
            "printf_msg": "Metric '%s' value is %.fC",
            "printf_var": "$self->{result_values}->{instance}, $self->{result_values}->{value}"
         }
      }
   }
}

Result on centreon commande line :

OK: Metric 'motorWaterTemp' value is 56C | 'motorWaterTemp'=56C;55:95;50:100;;
Metric 'motorWaterTemp' value is 56C


Config file oil pressure :
(value return modbus : 468 => 4.68Bar)
{
   "selection": {
      "motorOilPressure": {
          "address": 1024,
          "quantity": 1,
          "display": false
      }
   },
   "virtualcurve": {
      "motorOilPressure": {
         "unit": "Bar",
         "aggregation": "avg",
         "custom": "/100",
         "warning": "7",
         "critical": "8",
         "formatting": {
            "printf_msg": "Metric '%s' value is %.2fBar",
            "printf_var": "$self->{result_values}->{instance}, $self->{result_values}->{value}"
         }
      }
   }
}

Result on centreon commande line :

OK: Metric 'motorOilPressure' value is 4.68Bar | 'motorOilPressure'=4.68Bar;0:7;0:8;;
Metric 'motorOilPressure' value is 4.68Bar


Config file rpm motor :
(value return modbus : 1502 => 1502rpm)
{
   "selection": {
      "motorRpm": {
         "address": 1030,
         "quantity": 1,
         "display": false
      }
   },
   "virtualcurve": {
      "motorRpm": {
         "unit": "trs/min",
         "aggregation": "avg",
         "warning": "1505",
         "critical": "1507",
         "formatting": {
           "printf_msg": "Metric '%s' value is %.frpm",
           "printf_var": "$self->{result_values}->{instance}, $self->{result_values}->{value}"
         }
      }
   }
}

Result on centreon commande line :

OK: Metric 'motorRpm' value is 1502rpm | 'motorRpm'=1502trs/min;0:1505;0:1507;;
Metric 'motorRpm' value is 1502rpm


Confif file carburant motor :
(value return modbus : 73 => 73%)
{
   "selection": {
      "motorCarburant": {
          "address": 1027,
          "quantity": 1,
          "display": false
      }
   },
   "virtualcurve": {
      "motorCarburant": {
         "unit": "%",
         "aggregation": "avg",
         "warning": "40:100",
         "critical": "30:100",
         "formatting": {
            "printf_msg": "Metric '%s' value is %.0f%%",
            "printf_var": "$self->{result_values}->{instance}, $self->{result_values}->{value}"
         }
      }
   }
}


Result on centreon commande line :

OK: Metric 'motorCarburant' value is 73% | 'motorCarburant'=73%;40:100;30:100;;
Metric 'motorCarburant' value is 73%


I would like to insert the 3 values under the same interface, with the option to make separated virtualcurve if possible.


Exemple :

{
    "selection": {
        "motorOilPressure": {
            "address": 1024,
            "quantity": 1,
            "display": false
        },
        "motorWaterTemp": {
            "address": 1025,
            "quantity": 1,
            "display": false
        },
        "motorCarburant": {
            "address": 1027,
            "quantity": 1,
            "display": false
        },
        "motorRpm": {
            "address": 1030,
            "quantity": 1,
            "display": false
        }
    },
    "virtualcurve": {
        "motorOilPressure": {
            "unit": "Bar",
            "aggregation": "avg",
            "custom": "/100",
            "warning": "7",
            "critical": "8",
            "formatting": {
                "printf_msg": "Metric '%s' value is %.2fBar",
                "printf_var": "$self->{result_values}->{instance}, $self->{result_values}->{value}"
            }
        },
        "motorWaterTemp": {
            "unit": "C",
            "aggregation": "avg",
            "warning": "55:95",
            "critical": "50:100",
            "formatting": {
                "printf_msg": "Metric '%s' value is %.fC",
                "printf_var": "$self->{result_values}->{instance}, $self->{result_values}->{value}"
            }
        },
        "motorCarburant": {
            "unit": "%",
            "aggregation": "avg",
            "warning": "40:100",
            "critical": "30:100",
            "formatting": {
                "printf_msg": "Metric '%s' value is %.0f%%",
                "printf_var": "$self->{result_values}->{instance}, $self->{result_values}->{value}"
            }
        },
        "motorRpm": {
        "unit": "trs/min",
            "aggregation": "avg",
            "warning": "1505",
            "critical": "1507",
            "formatting": {
                "printf_msg": "Metric '%s' value is %.frpm",
                "printf_var": "$self->{result_values}->{instance}, $self->{result_values}->{value}"
            }
        }
    }
}


CRITICAL: Metric 'motorCarburant' value is 520% - Metric 'motorWaterTemp' value is 520C | 'motorCarburant'=520%;40:100;30:100;; 'motorOilPressure'=5.2Bar;0:7;0:8;; 'motorRpm'=520trs/min;0:1505;0:1507;; 'motorWaterTemp'=520C;55:95;50:100;;
Metric 'motorCarburant' value is 520%
Metric 'motorOilPressure' value is 5.20Bar
Metric 'motorRpm' value is 520rpm
Metric 'motorWaterTemp' value is 520C


On interface centreon :


In my settings file, I think that I might not have the right settings because my values are wrong.
In your opinion, how can I register the right values ?


Thanks you for reply.

Best regard,

Userlevel 1
Badge +5

Hello. I also have to monitor an electrical generator using modbus but I am not clear about the meaning of the fields.

If I use address 1029 as in the originally reported case I get a similar value, 255, which I assume would be 25.5V

But I'm trying other addresses I don't get what I expect (or I don't know how to read it).

I got a table with addresses in hexadecimal from the maker but those don't work with the plugin. Am I suppossed to convert those to other format?

These are some examples of the info I got from the maker.

Address          
(hexadecimal)
Description Function Read/Write Nº bytes
0010 Seconds:Minutes 03 R 2
0011 Hours:week day 03 R 2
0012 month_day:mes 03 R 2
0013 year:reservado 03 R 2


So, what should I use in the address. Any link that explains what is the meaning of address, quantity, display, etc?

Regards,

Emeck

Userlevel 1
Badge +5

Got it!

The maker gave us some missleading data and the clock was also wrongly configured.

Userlevel 1
Badge +7

If I use address 1029 as in the originally reported case I get a similar value, 255, which I assume would be 25.5V

if this is the generator im thinking, 1029 is battery voltage * 10, which means you can divide it using custom tools:
 

{
"selection":{
"battery":{
"address": 1029,
"quantity": 1,
"display": true
}
},
"virtualcurve":{
"battery":{
"unit": "V",
"aggregation": "avg",
"critical": 15,
"custom": "/ 10"
}
}
}


Userlevel 1
Badge +5

@kozfelipe 

Thanks for the reply.

Yes that works for me also as expected. But that is not what I need to monitor.


I need to check addresses that return a value of 16 bits. Each bit means on/off status for an alarm or function of the generator. I have succesfully configured a check for several type of alarms we wan to monitor in Centreon using thise config:

{
    "selection":{
        "AlarmasParoB1":{
            "address": 0,
            "quantity": 1,
            "type": "holding",
            "display": false
        },
        "AlarmasParoB2":{
            "address": 1,
            "quantity": 1,
            "type": "holding",
            "display": false
        },
        "AlarmasPreventivasB3":{
            "address": 2,
            "quantity": 1,
            "type": "holding",
            "display": false
        },
        "AlarmasPreventivasB4":{
            "address": 3,
            "quantity": 1,
            "type": "holding",
            "display": false
        }
    },
    "virtualcurve":{
        "AlarmasParoB1":{
            "aggregation": "avg",
            "critical": 0
        },
        "AlarmasParoB2":{
            "aggregation": "avg",
            "critical": 0
        },
        "AlarmasPreventivasB3":{
            "aggregation": "avg",
            "critical": 0
        },
        "AlarmasPreventivasB4":{
            "aggregation": "avg",
            "critical": 0
        }
    }
}

The output for that config is:

OK: Global metrics are OK | 'AlarmasParoB1'=0;;0:0;; 'AlarmasParoB2'=0;;0:0;; 'AlarmasPreventivasB3'=0;;0:0;; 'AlarmasPreventivasB4'=0;;0:0;;

The metrics are returned in decimal but if any alarm is triggered its bit will be 1 and the metric will be greater than 0, so the check should appear as CRITICAL. I guess I have this right.


My problem is with another address I need to check. This is the config:

{
    "selection":{
        "EstadoSistemaB7":{
            "address": 6,
            "quantity": 1,
            "type": "holding",
            "display": true
        }
    }
}

And its output:

OK: Metric 'EstadoSistemaB7' value is '50568' - Metric 'EstadoSistemaB7' value is '50568' | 'EstadoSistemaB7'=50568;;0:50600;; 'EstadoSistemaB7'=50568;;;;

The value '50568' is '0b1100010110001000' in binary and of those 16 bits I need to check bits #9 and #10 (counting from right to left and starting in 0 por the position). Those bits are Out of Service (value 0) and Automatic Start (value 1) which is what we need.


Is it possible to convert the value I get to binary and then check those 2 bits with a virtualcurve setting?


Regards,

Enrique

Userlevel 1
Badge +5

Hello.


Since I didn’t find how to do it with the config file, I made a script to launch the plugin command, capture the output, extract the metric value, convert it to binary, apply a mask for the position and check the bit.


Seems to be working. At least it detected two state changes last monday.


Regards,

Enrique

Reply