When you monitor a host the values in perfdata have the max values.
Is it possible to visualize this max value into Centreon grahs, without exploding the max value ?
I don’t want to use the explode perfdata, because I already have multiple value into the graph.
For examples :
"centreon-engine@xxxxxx plugins]$ ./centreon_plugins.pl --plugin=apps::monitoring::netdata::restapi::plugin --mode=disks --hostname=xxxxxxx  --proto=https --fs-name='^(?!(/dev|/run|/boot|/srv/varoptbesclient))' --filter-perfdata='usage.bytes'
OK: All partitions are ok | '/#storage.space.usage.bytes'=4778252585B;;;0;9923968936.12933 '/appli#storage.space.usage.bytes'=73429015B;;;0;2936442404.10378 '/appli/log#storage.space.usage.bytes'=6856700B;;;0;1922490497.70885 '/appli/var#storage.space.usage.bytes'=1240043494B;;;0;30312924081.8156 '/home#storage.space.usage.bytes'=222396413B;;;0;952840212.604518 '/tmp#storage.space.usage.bytes'=17592293B;;;0;3861790960.54333 '/var#storage.space.usage.bytes'=5700491585B;;;0;9923969043.50351 '/var/tmp#storage.space.usage.bytes'=127369187B;;;0;952840212.604518
Page 1 / 1
Hi,
For the moment, the max value can’t be displayed as a curve.
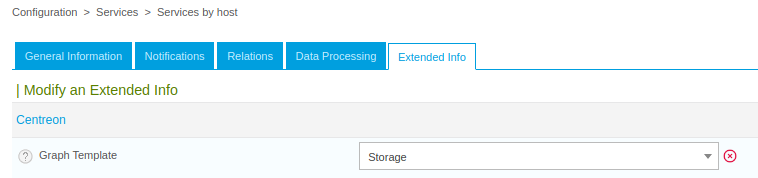
As a compromise, you can select “Storage” as your service’s (or service template’s) Graph Template:
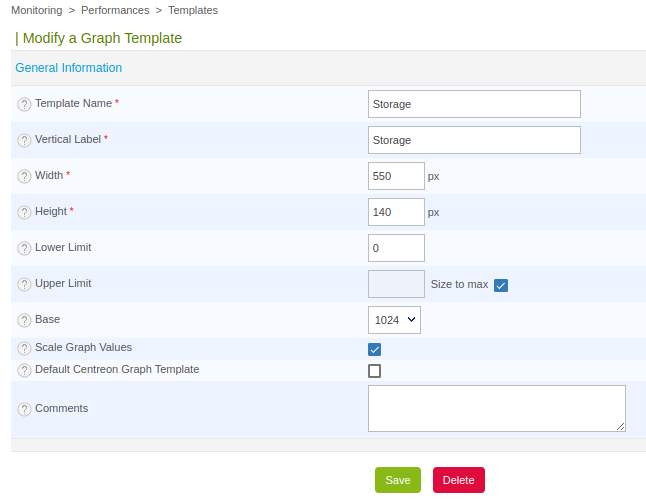
As I said, you won’t have a line for the max value(s) but the curve will be scaled according to the max value (“Size to max” checkbox):
Does this workaround fit your need?
Thanks for your reply.
I will test that.
Edit: I see now: “I don’t want to use the explode perfdata”
With plugin os::linux::snmp::plugin, mode storage, there is the option --explode-perfdata-max
p...] --explode-perfdata-max
OK: All storages are ok | 'used_/var/lib/mysql'=142307217408B;0:184650039296;0:207731294208;0;230812549120 'used_/var/lib/centreon'=34792611840B;0:55824089088;0:62802100224;0;69780111360 'used_/var/lib/mysql_max'=230812549120B;;;; 'used_/var/lib/centreon_max'=69780111360B;;;;
Check if your plugin & mode have that option
Thanks for your answer, but when you already have multiple data in the same check, I think the graph is less readable. That’s why i’m searching a solution without exploding max perfdata.
It may not be what you want, but I’m not a big fan of service checking multiple things (multiple FS, nic, etc, if I have a critical alert or warning, I need the specific service, not all the filesystems, in red)
So my approach to this is to have 1 service per file system
in your case, as each FS have different max value, this could be your solution
additionally you can rename the “max” metric with
--explode-perfdata-max=',size'
the max metric is now named “size” which can be nice to have a red curve for your graph, and have a storage graph template starting from 0.
you get graph that looks like old centreon/nagios, it’s mostly cosmetic, and you lose the warning/critical lines (you need to split the graph to see them, or export the graphic a png))
I really wish the RRD graph would automatically size to the max value, even if the max is not displayed, it would make things easier