Hello everyone,

I was trying to monitoring the bandwidth of a network interface with ‘OS-Windows-Traffic-Generic-Name-SNMP-custom’  but i get an ‘Unknown’ with this following sentence:

“ Unknown option: regexp at /usr/lib/centreon/plugins/centreon_windows_snmp.pl line 141. ”

I tried the EXTRAOPTIONS with --regexp and without but that didn’t change anything. I search in the file but i don’t find anything and the SNMP is activate in my server.


If anybody have an idea i’ll take it.

Hello @Ced o/

Following the manual of the probes, option --regexp doesn’t exist.
 

Using --interface=’^eth0$’ --name is enough :

  --interface
            Set the interface (number expected) ex: 1,2,... (empty means
            'check all interface').

    --name  Allows to use interface name with option --interface instead of
            interface oid index (Can be a regexp)
Regards,


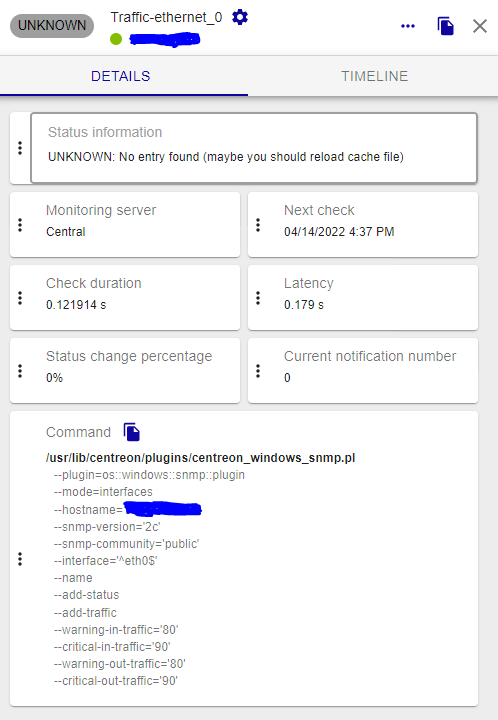
Thanks @Kriko  to reply to my question however after delete the previous ressource and create another one i had a new problem (image below).


I tried to reload the cache and i delete twice this but i have always the same problem.

Do you have another idea?

Kind regards,

Ced


Hello Ced,

I guess, it’s because the interface eth0 doesn’t exist on a windows server.

Maybe you can try to use the service discovery to get the interface of your windows host (or use the mode --list-interfaces of the plugin):

https://docs.centreon.com/docs/monitoring/discovery/services-discovery/#discovery-rules


Hello,

Sorry for the delay i was on week-end and I haven’t be able to work on my centreon.

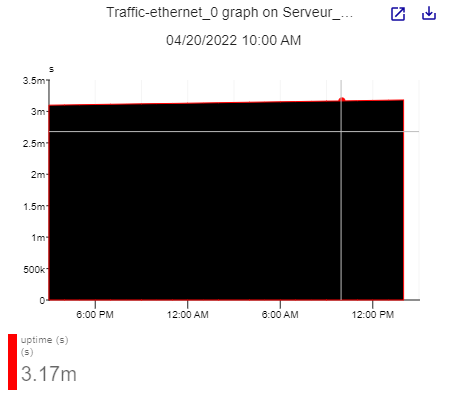
Like you said I create a service discovery that work, i was able to select the eth-0 however with this new rule, (it take OS-Windows-Uptime-SNMP-custom) centreon tell me it is okay however the graph don’t work, it show nothing.

So i search around the web and saw one of your previous replies:

(

)

It is exactly what i have wanted to do, so if u remember how to create this service it would be very useful to me.


Kind regards

Ced,


Uptime service ?

You can simply bind the template OS-Windows-Uptime-SNMP-custom to the template OS-Windows-SNMP-custom host template and then deploy again the service on your host.

Or maybe I don’t understand your need ^^’


I’m sorry english isn’t my native language 😅, so i have discovered that you had already create what i have wanted and wanted to know how did you do it.

I have copy-paste the link of the previous thread above.


Oh okay I see.

So you get your traffic service by interface but you have no graphs right ?

What is the output of the plugin ?


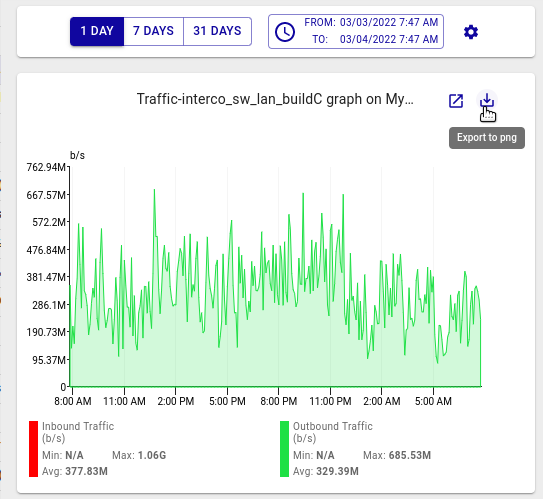
Well with the auto discovery i take the ethernet-0 but it take the uptime but i would have the internet traffic.

Not like this:

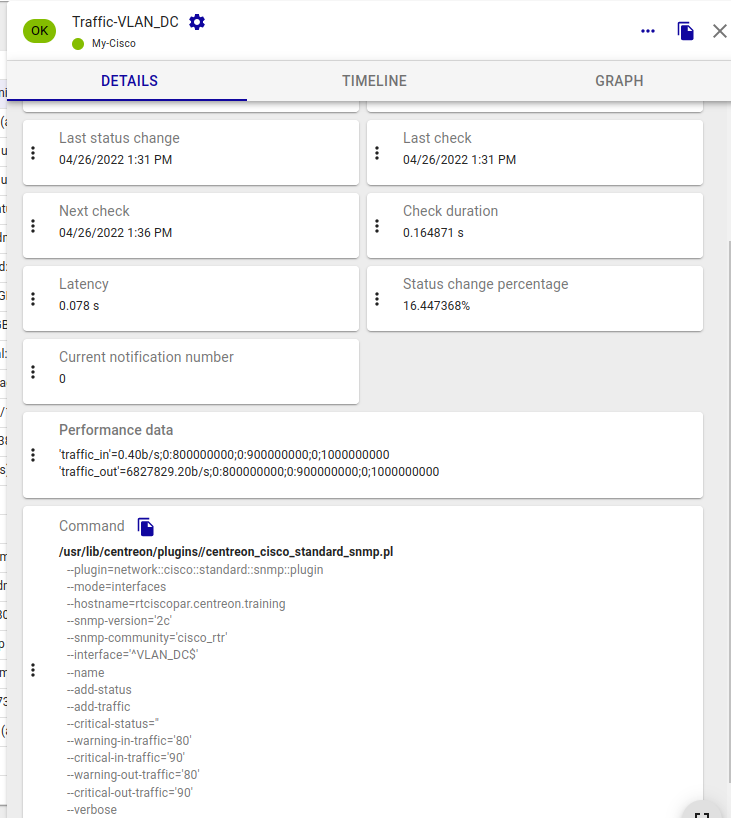
But like this:


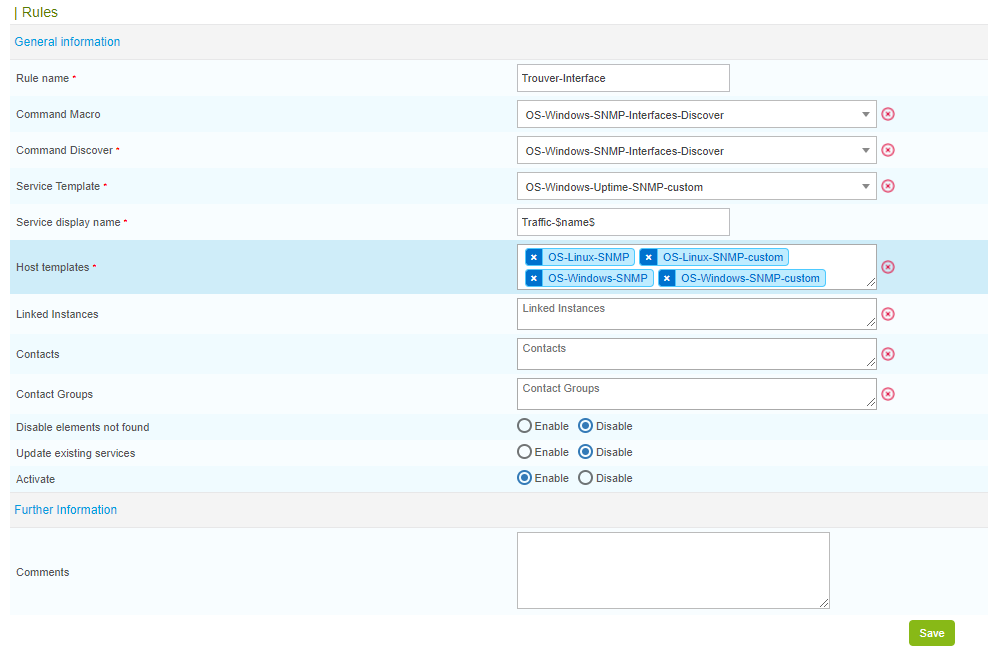
Could you show me your discovery rule ? 🤔


It take this rule that i have create, does it come from that?


Ok so here there is some things that are not logical.

Actually the service template used to create the end service is Os-Windows-Uptime-SNMP-custom which is why that you have the uptime and not the traffic :)
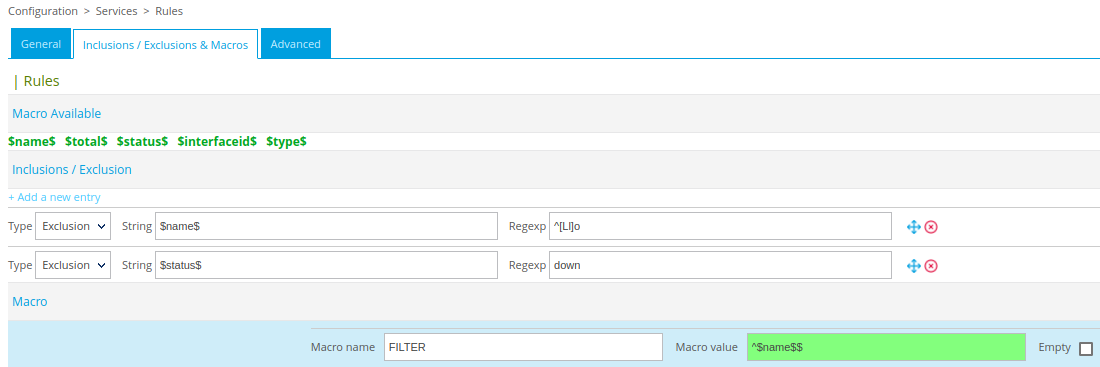
Change it for Os-Windows-Traffic-Global-SNMP-custom and set right macro just like the screenshot below:
 

Then you rule is activate, it’s mean that every day at 10.00.pm an automatically discovery will be launch and every hosts that inherited from the host template defined in the rule will be perform so be carefull.


And for the end, you apply a windows rule on linux host following the host template bound to your rule.


You will find more information about the discovery service here: https://docs.centreon.com/docs/monitoring/discovery/services-discovery/


Yep.
 

In your rule, you define Os-Windows-Uptime-SNMP-custom as the service template. This service template will be used as the template of your end services.

You need to choose Os-Windows-Traffic-Global-SNMP-custom and configure your rule like the screenshot below:


And be careful with the host template bound to your rules: the scan will be perform on the Linux Server.
 

Check our documentations about service disco: https://docs.centreon.com/docs/monitoring/discovery/services-discovery/


So after change the things you said i have one problem and one thing different from you:

The thing different (i can’t overwrite this or delete this) ;

The problem (where should i try --snmp-autoreduce):


You can setup --snmp-autoreduce in the host macro SNMPEXTRAOPTIONS directly :)


To setup the --snmp-autoreduce and because of the SNMPEXTRAOPTIONS (i don’t where it is so i tried in the macro of the service and in the template) i needed to put the SNMP version3 (before i had the version 2c who work perfectly) but after i have a problem with ‘Missing parameter Security Name’ what should I do?

I never work before with SNMP and i find on internet that the SNMPv3 has a lot of more setting for the protection and i m kind of loose 😪.


SNMPv3 is the secure version of SNMP, and if your device/server is configure to used it, in the plugin you need to set up the privpassphrase, the user, the procotol and other parameters following your configuration.

Is the SNMPv3 is configure on your end server ? if not, keep v2c as the version :)


I search and i find that windows server 2016 don’t support SNMPv3 so I choose to go back to the 2c version. I create a new template with ‘OS-Windows-Traffic-SNMP-custom’ as base.

Here is the result in the service but i have always the same error ‘ try --snmp-autoreduce ’.
 

^ethernet_0$  come from the scan.


Weird.
Did you export the configuration of the central/poller ?
Can you show me the command line from the real time view ?


Yes i have export the configuration to the poller (two times to be sure that’s good)

But where did u see this command line?


In the real time here:


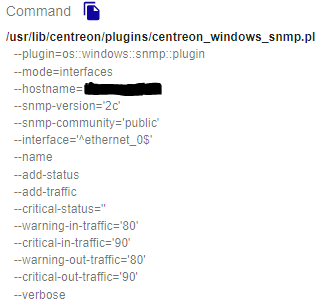
Sorry for the delay but here is the command in the real time:


Hello @Ced,


We can see that the --snmp-autoreduce option was not added to the command line. It seems that there was an error on the export. Are you sure your poller is connected to your central ? You can check the connection by running the following command :

ss | grep 5556


You should see something like this :

tcp    ESTAB      0      0      < Central IP >:XXXX                 < Poller IP >:5556


Regards.


Reply