Hello everyone, i have a small problem that impact only a few of the hosts that i monitor.
The most blatant are “Server1” and “Server2” (cf pictures)
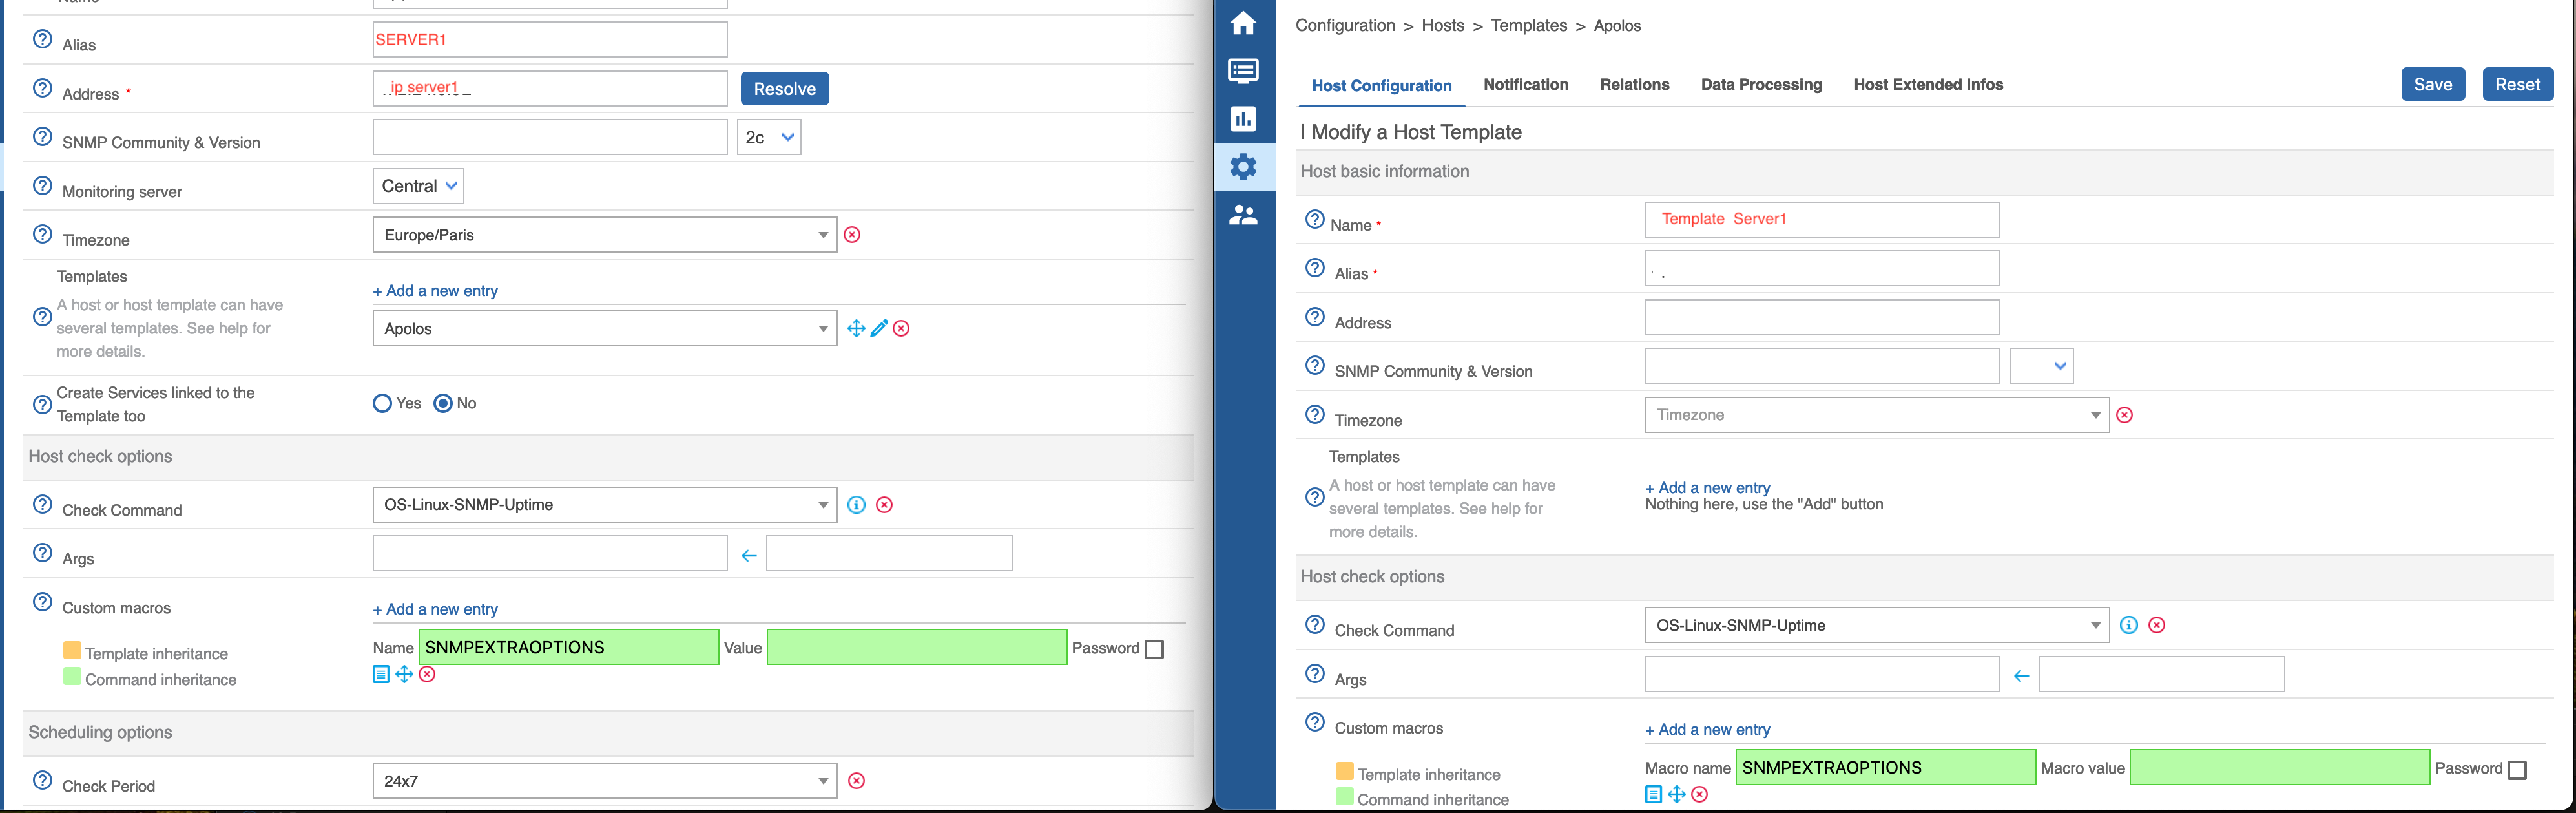
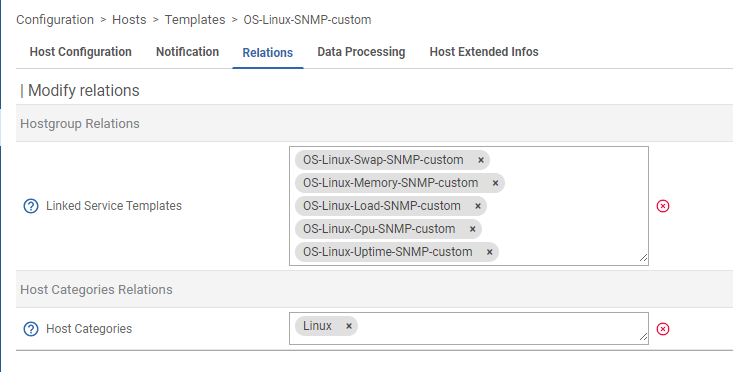
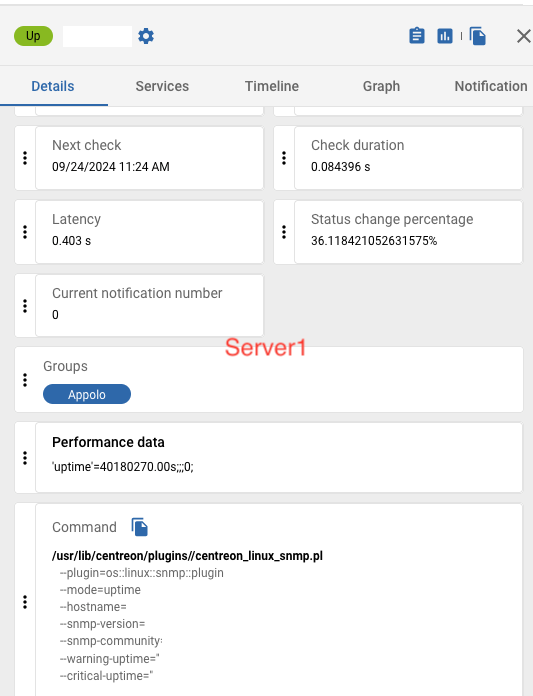
Server 1 and 2 both have as a check command “Linux-SNMP-Uptime” (defined by their hostgroup) However they do not behave exactly like other in their hostgroup neither are they behaving like each other, and i cannot understand why.
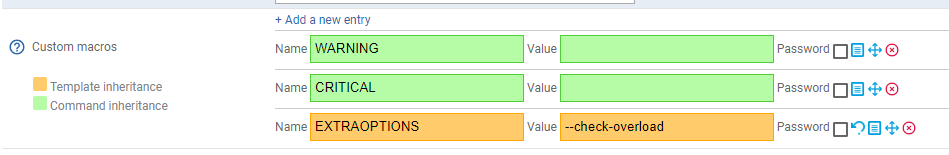
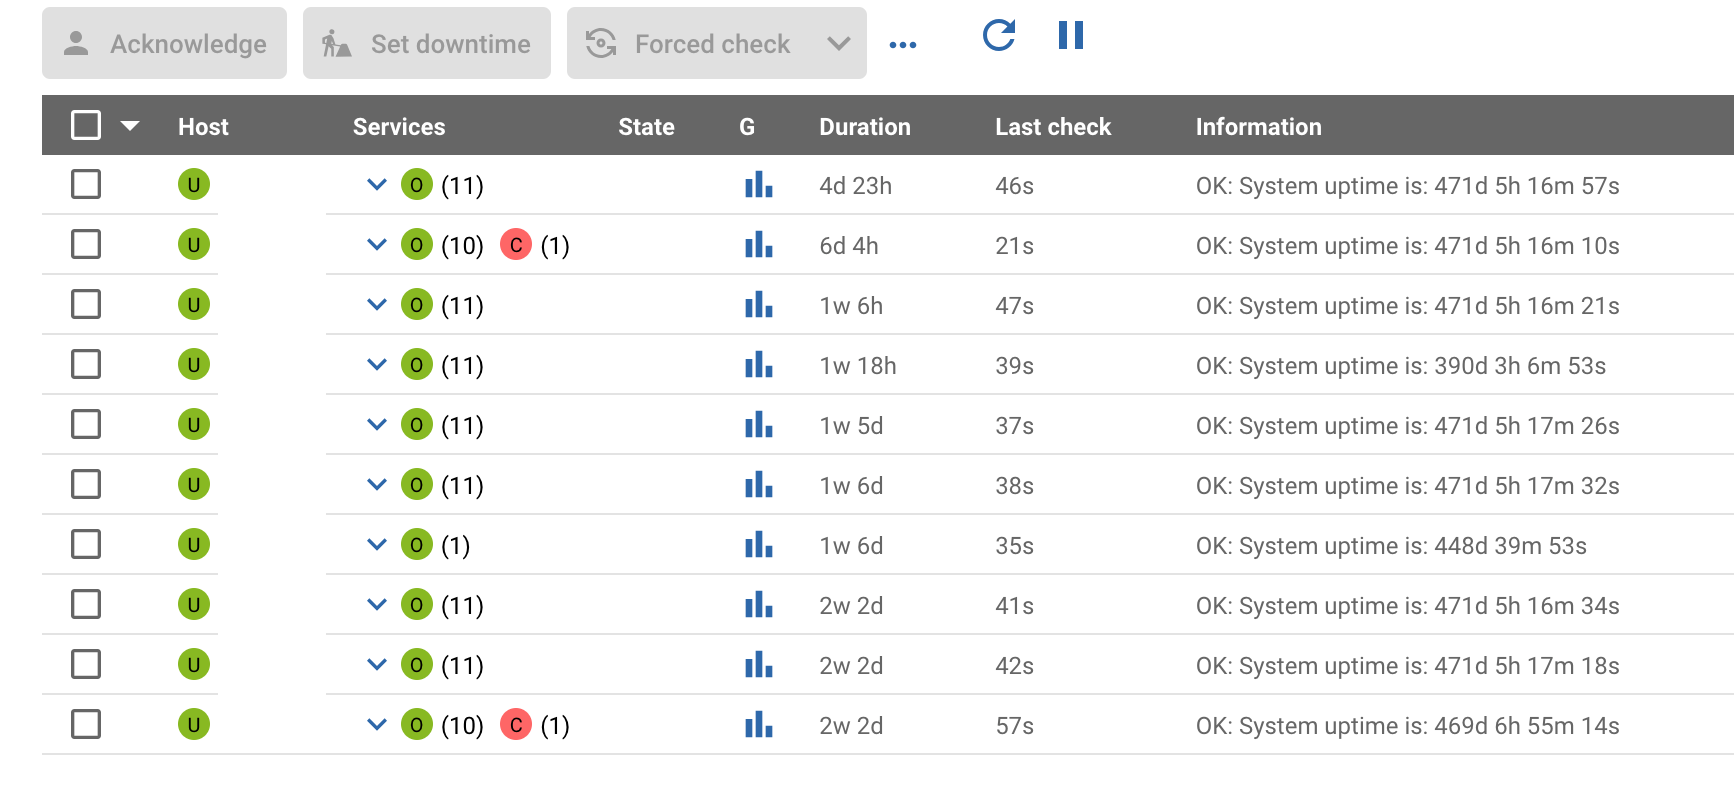
As you can see in this image, Server one (sometimes) says that the warning threshold is wrong, and Server2 that the uptime is Critical for being 465 days

The problem is that i never inputed any of these weird warning values for server 1 and other servers with as much uptime as Server2 do not show any critical state.
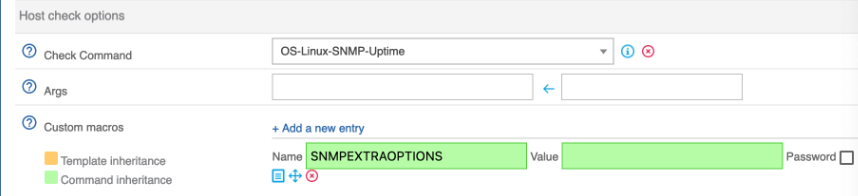
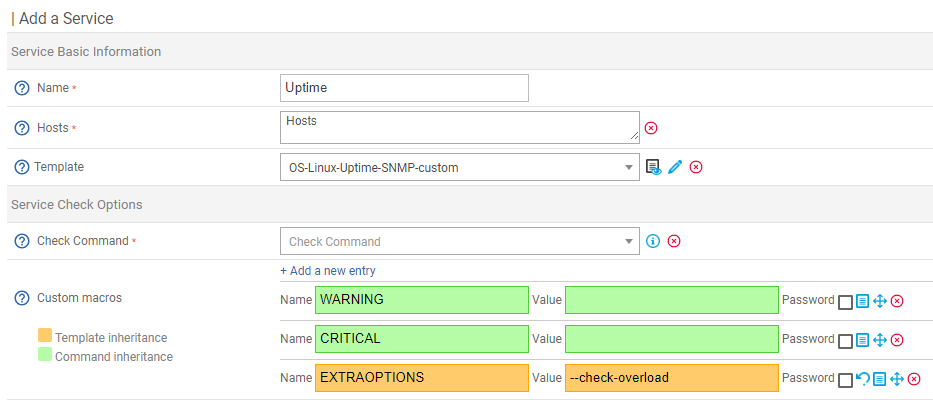
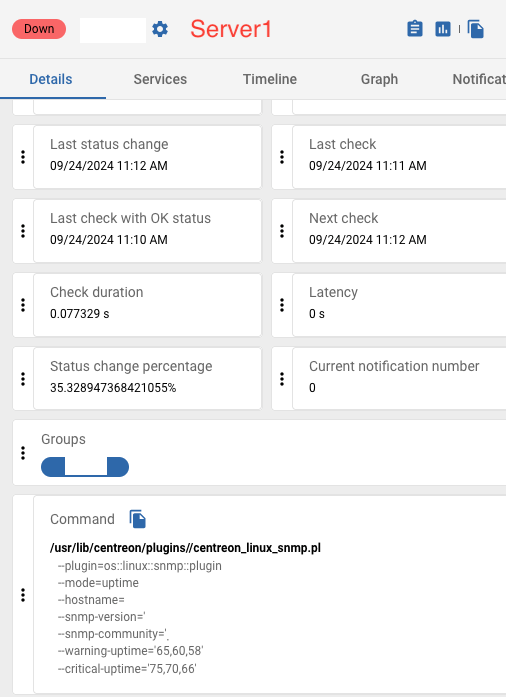
Here we can see that Server1 command act as if some weird values are used to check warnings and critical states.
Server2 seems to have regular options.
So There is what they show half of the time , whether shown as down or in critical status because of something i do not understand, however, sometimes they will return to normal and i really cannot grasp why that is.
An exemple of this:

These are the same servers but sometimes their value will return to normal,
We can see here that server1 does not show any of the warning or critical uptime anymore.
So the two servers are balancing between these two states and i really cannot grasp why that is. Why is Server1 sometimes using weird value for warning or critical sometimes but sometimes wont. I couldnt make any correlation between any event and this problem appearing or diseappearing, id say it switch something like every 10 minutes or something.
Does anybody have any idea what might happen here?
Thank you a lot for reading this if you did and have a great day.
Noam Monmarché