Hello Community,


I need to do a report on Uptime from all of my servers (windows or Linux).

I have the service that give me the uptime of all of my servers configured.

they are all in state OK because I didn’t create warning or critical limits. I only have a “time”.

But I don’t find the adequate report to have all these data reported.

I just need a report with host and uptime. I think the issue is all events are in OK state.


Could you help me?


Laurent

Hello @LaurentV ,

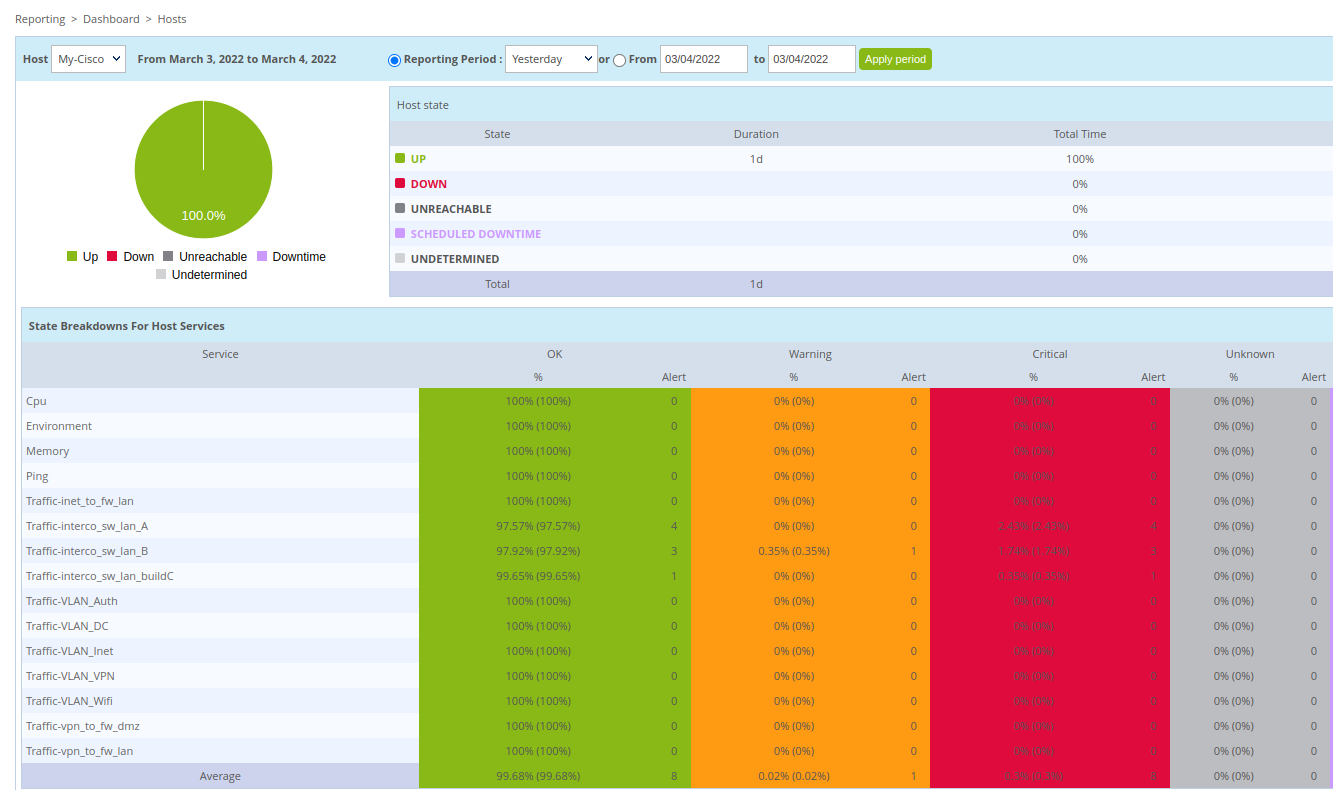
I guess that you can use the dashboard page:


On this page you will get a percentage of avaibility of your resources (hosts and services) for a timeperiod. And you can even export them into CSV to exploit them.

But maybe I missunderstood your needs. 


Hello,


Yes, I founded it but it isn’t my need.

What I need is the uptime value value in a report.

I don’t find the way to have it in a report…


Laurent


Got you!
Presently we don't have reporting feature (except the one I show you) in Open Source/IT Edition (there is a reporting extension in Business Edition).

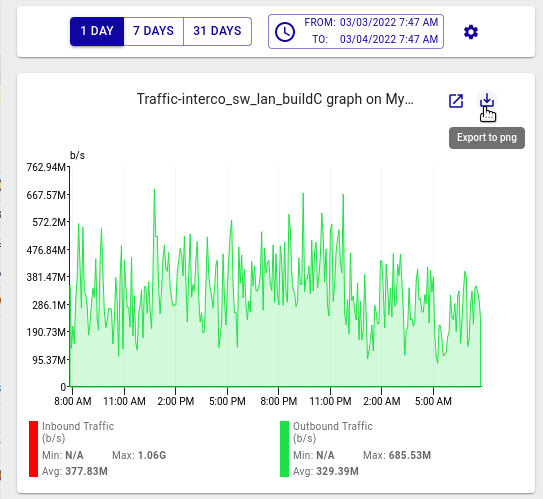
I guess that you can export the graphs in PNG if you need to compute and share it by clicking here on the detail of the service:

Fell free to post your need on the Ideas Page: 
https://thewatch.centreon.com/ideas
https://thewatch.centreon.com/news-37/how-ideation-works-in-the-watch-337


Hello,

Thanks for your response.

I have the MBI extension with my Business Edition, so access to reporting.

But I don’t find any report for my needs :-/


If the need it’s to have the output of all the services “uptime” (or any kind of service) in a report, yep unfortunatly we do not provide this kind of reports (Again, feel free to ask on Ideas).

If the need it’s to have the graphical I guess that you can use this kind of reports: https://docs.centreon.com/docs/reporting/reports#hostgroup-graphs-v2


Reply