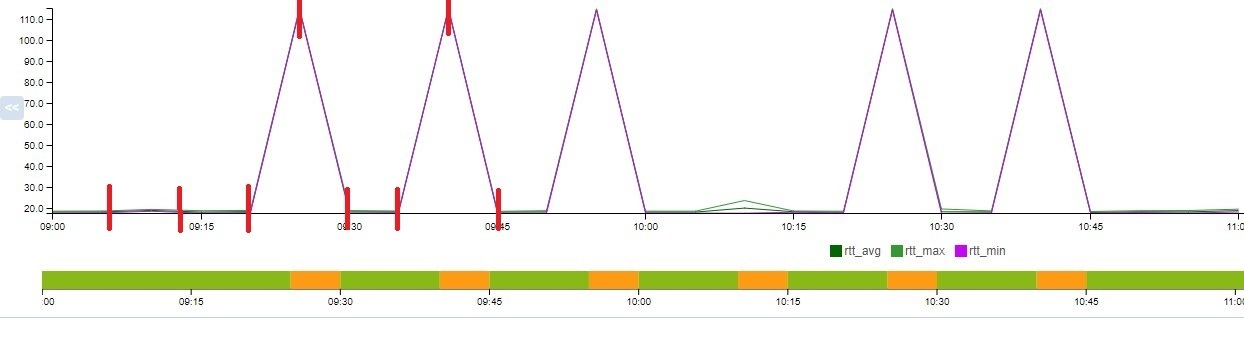
On my graph, I see dots every 5 minutes, marked in red.
These points, placed every 5 minutes, are calculated from measurements taken every minute. So 5 measurements every minute Centreon calculates the average of these 5 measurements and then displays it. I would like to display the instantaneous value measured every minute.
The instantaneous values available are updated every minute and take either a value of 15 or 500.
So if for 5 minutes centreon measures a value of 500 centreon will display 124.
(15+15+15+15+500)/5=112 which corresponds to the maximum value on my graph.
However, if for 5 minutes it only sees values at 15, it will display 15.
What should I do? (I've already tried making several changes to my service settings, graph.... without success).
If this isn't possible, how can I get it to display the maximum value seen during the 5 minutes ?