


Hello,
I am pretty begginer in this area, but I would try to learn more.
It monitors disk occupancy at 99% by giving Critical and Warning limits in percent. In contrast, I recently had to change from % to Byte. After this change, the monitoring works properly, but the displayed chart no longer does.
How it was set and look like:
/usr/lib/nagios/plugins/centreon-plugins/centreon_plugins.pl
	--plugin=os::windows::snmp::plugin
	--mode=storage
	--hostname=10.10.10.10
	--snmp-version='2c'
	--snmp-community='Test'
	--storage='D:'
	--name
	--display-transform-src='^(..).*'
	--display-transform-dst='$1'
	--warning-usage='85'
	--critical-usage='90'
	--explode-perfdata-max='used,size'
	--filter-perfdata='size|used|free'
	--regexp
Graphics chart looks like this
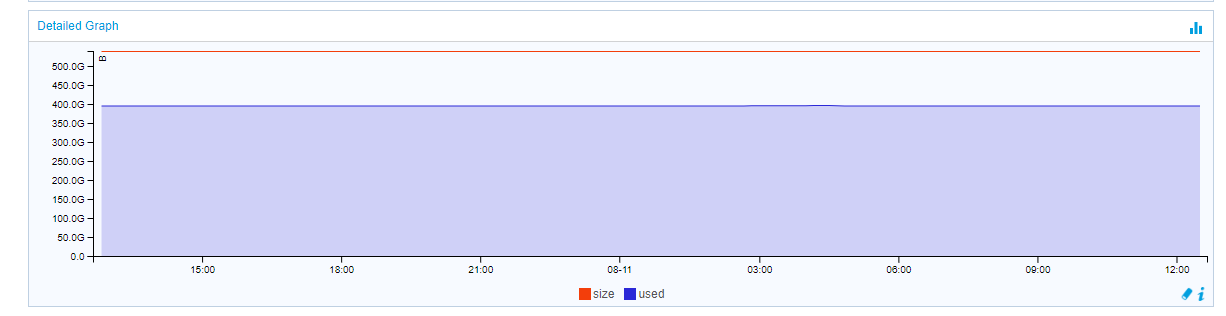
After changing to ranges in bytes (graphics is just example - diffirent disk):
/usr/lib/nagios/plugins/centreon-plugins/centreon_plugins.pl
	--plugin=os::windows::snmp::plugin
	--mode=storage
	--hostname=10.10.10.10
	--snmp-version='2c'
	--snmp-community='Test'
	--storage='D:'
	--name
	--display-transform-src='^(..).*'
	--display-transform-dst='$1'
	--warning-usage='100000000000:'
	--critical-usage='50000000000:'
	--explode-perfdata-max='used,size'
	--filter-perfdata='size|used|free'
	--units='B'
	--free
	--regexp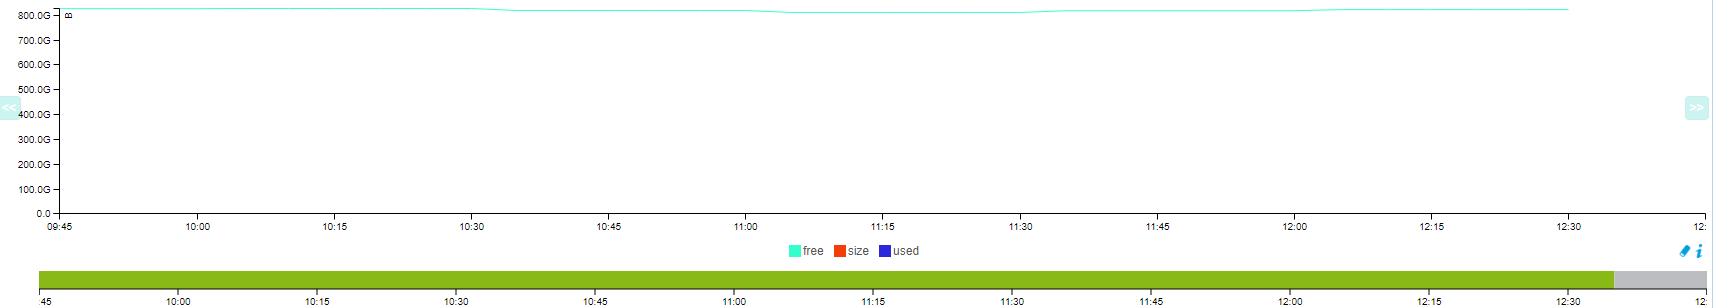
Currently, it does not show used and size on the chart.
