Hello Watch community !

The purpose of this topic is to know how I can modify the result of the check_icmp. Currently I have the following results (packet loss, rta min, rta max, rta average).


>centreon-engine@poller ~]$ /usr/lib64/nagios/plugins/check_icmp -H 10.1.2.3 -n 4 -w 1000,40% -c 4000,80%
OK - 10.1.2.3 rta 125.546ms lost 0%|rta=125.546ms;1000.000;4000.000;0; pl=0%;40;80;0;100 rtmax=126.204ms;;;; rtmin=125.043ms;;;;
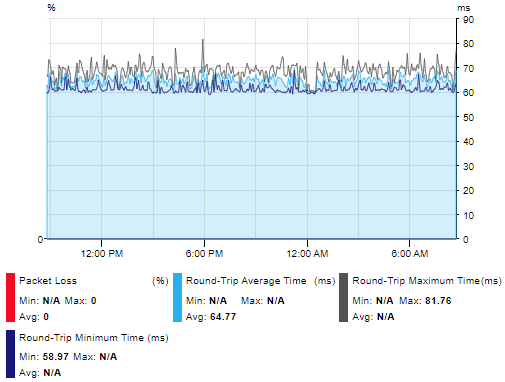


I’d like to have only packet loss and rta average, not rta min and rta max.

I tried  /usr/lib64/nagios/plugins/check_icmp --help without finding my answer.

Thanks,

Hello,

on other plugin, the adequate option is --filter-perfdata=’’, but I don’t know the equivalent for check_icmp plugin


Hello,

It seems there is no equivalent of filter-perfdata on check_icmp

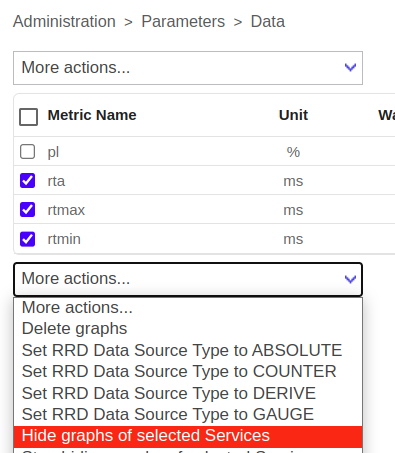
But if you just want the RTA perfdata to not show up, you can hide them from the menu Administration > Parameters > Data , click on the corresponding service and hide the RTA metrics


But you have to do this service by service, so if you have a lot of ping services, it will take some times 😅


Hope it helps


Thanks, it’s exactly what I’d like to monitor.

For sure, I’ll use it only on a few number of services (except if a script with CLAPI is possible to deploy it).


Reply