
Hello everyone. I don’t know if what i want to do is in fact really hard, if i’m taking it by the wrong end, or if i’m simply missing something.
I have a service that execute a shell script on my remote host. This script lists the 50 biggest cpu activ process and returns the users associated with it and how much cpu percentage each of them uses.
When i look at the service graph i get kind of what i want, some curves representing each of these values.
But when i want to add this supervision to my dashbord things become problematics. First i want to separate the two values that the service returns (numbers of active process and cpu utilization percentage) but this ultimately is not problematic as i can create a second service and divide the value between them.
But when i want to add a widget to either my dashboard or customview. There are no widget that offer to monitor all of the metrics given by a service, i have to manually check the metrics i want included.
The problem is that these metrics are dynamic, sometimes only 3 users will be represented, sometimes 20, so if i check at one point that i want the 10 metrics that are available at the moment, as soon as a new user start a process, it will not be represented.
I try to use regex in the metric selection, or seeing what i can do with filter but it doesn’t seem to be working.
Can you think of something that i’m either doing wrong or should be doing?
Sorry if by my lack of knowledge im asking a dumb question.
Thank you to everyone that took the time to read all of this.
Have a nice day
Noam Monmarché

I still dont know how to do this so if anyone happens to know what i could do it would be terrific!
Hello
For instance, I select a host group and I select my metrics. And the graph will scale when hosts will be added/removed in the host group. I guess we can call it vertical dynamic generation.
But generating a graph using a service introduce new way to generate graph in a more horizontal way. And it's another challenge because graph only support 2 units (2 axes). So whenever a service bubble up metrics with more than 2 units some units will not display well.
And we have to test how its behave when graphs are generated both vertically (using host groups) and horizontally (selecting all metrics of services). I guess most of those graph will be a mess to read IMO.
Thank you for your reply.
From what i understand there is no way to do what i want to do with this graph?
Just to try to be a little bit clearer, my service will tell me at any point which users are the most active on my server and tell me how much of the server’s cpu they use.
The problem is that the metrics wont have the same name each time because they have the name of the user that is present in this list.
When i select my metric i only have access to the users that are currently using cpu, but the next day it can be a whole new set of users who will not be represented in the graph because i will need to manually add their metric, which is less convenient than just logging in the server and typing my script manually.
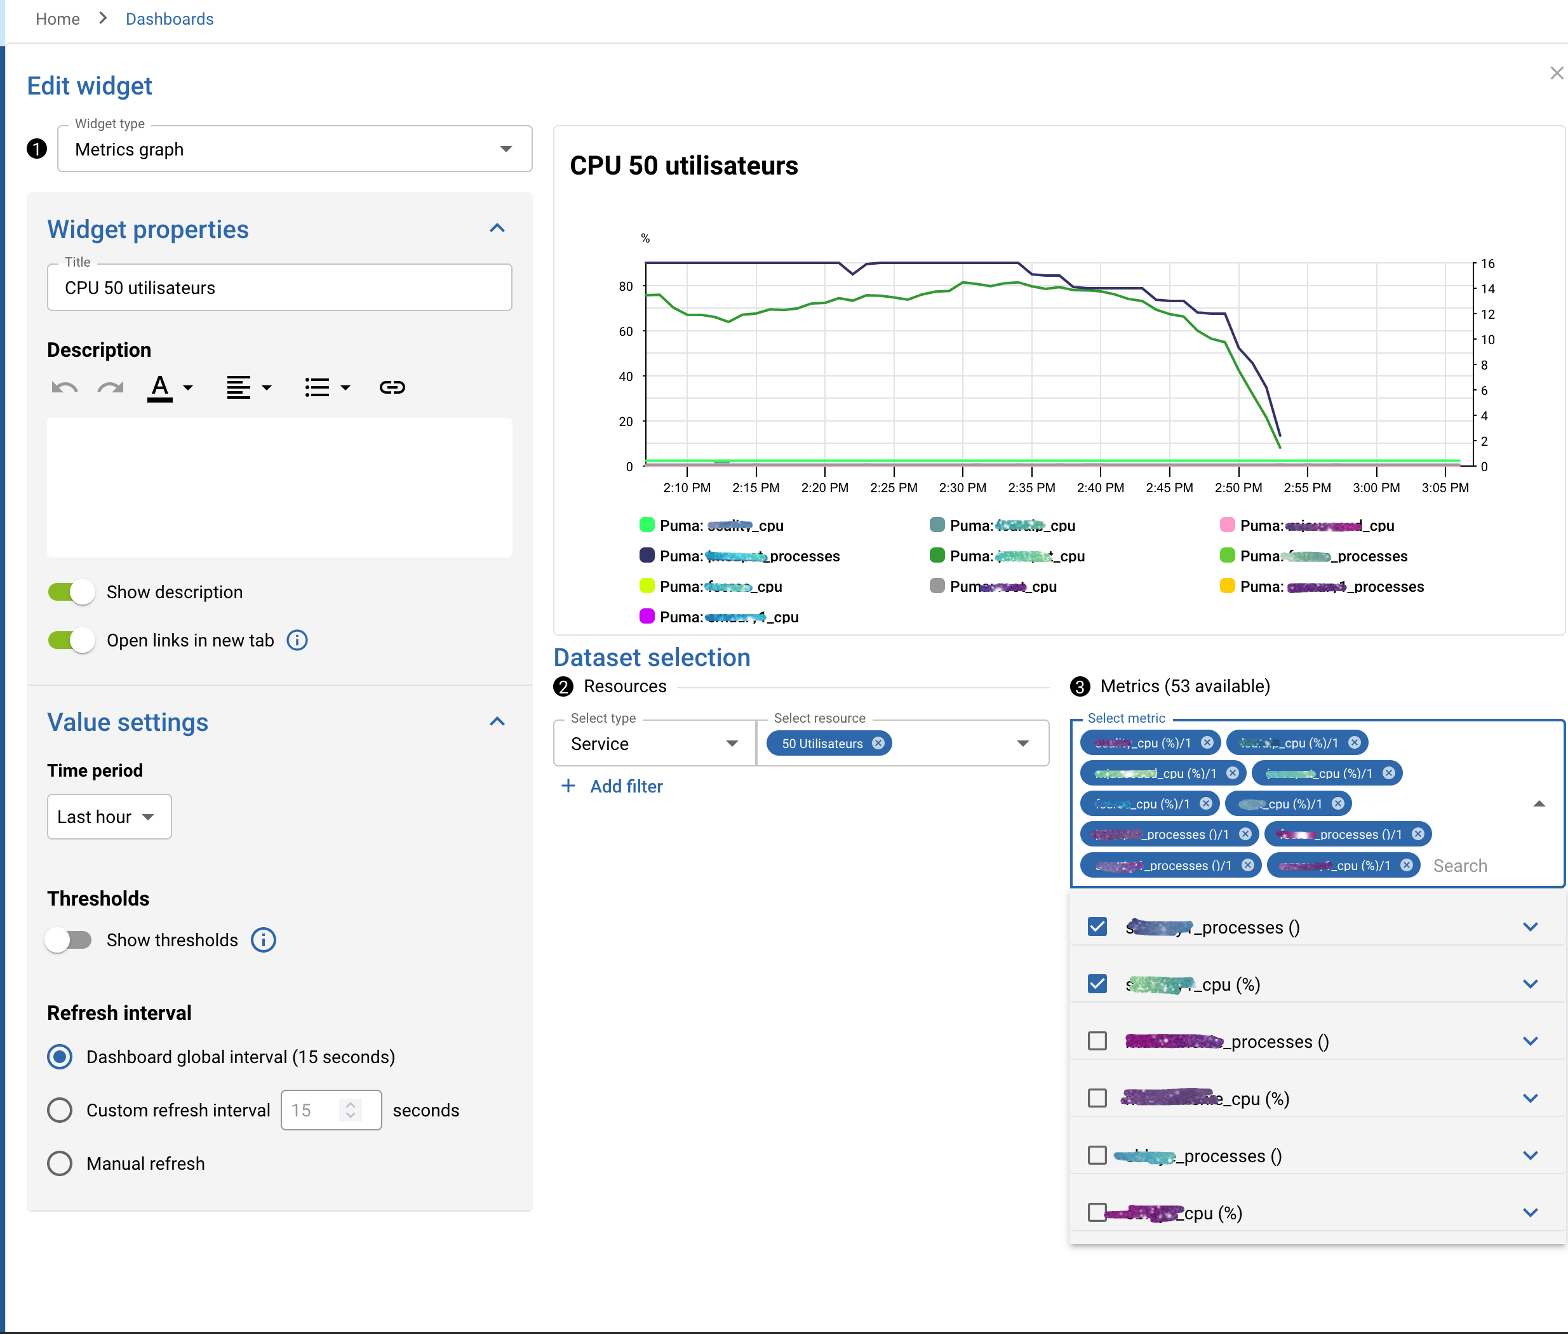
As you can see in this image, when i launched the service, i selected all the users that were listed as metrics, but as time went on other got added and some of the previous users stopped using the server so were not part of the metrics anymore.
I would just want to be able to select all of the metrics of my service so this part would be dealt with automatically
Thank you again for your time and have a great day
Reply
Login to the community
No account yet? Create an account
Enter your E-mail address. We'll send you an e-mail with instructions to reset your password.