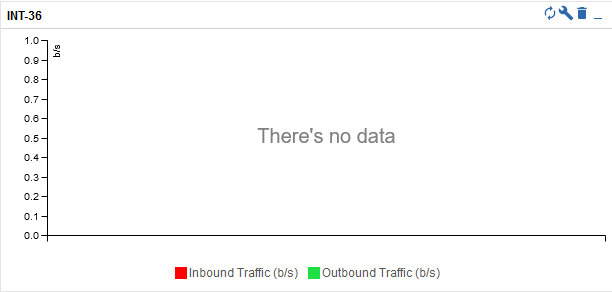
Now, all my graphs are stating that there is no data like so :
Can you please help me solving my issue ? =)
PS:
I do not think it has anything to do with it, but I had to run this command for centreonweb to work :
/usr/share/centreon/bin/console cache:clear
I do have centreon-broker-master properly configured (I checked other posts solutions)
Page 1 / 1
I noticed something weird in central-broker-master.log :
Any help would be greatly appreciated ! Wishing you happy holidays if so
Figured out it was just punctual errors and the TCP connection is working.
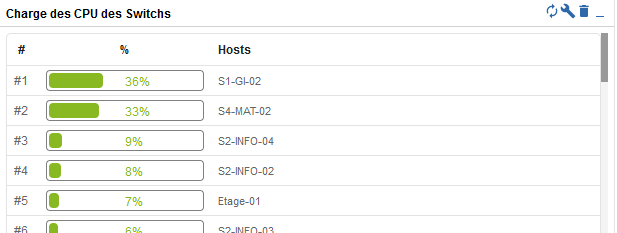
RRD files are getting updated, other widgets are working as intended, for example :
Huh… It’s been 3 days of debugging and I can’t even get a clue of why it isn’t working. I’m starting to think I’ll have to start fresh and reinstall everything.
I would greatly appreciate any clue of what could be happening since I’ve ran out of ideas !
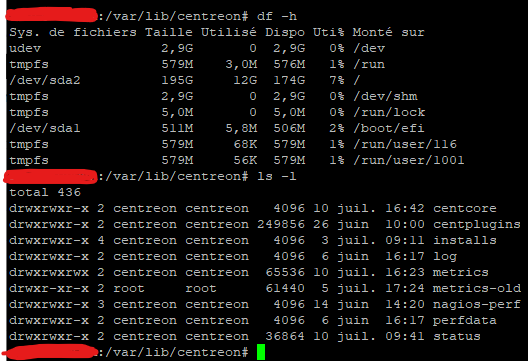
Hi @Yllake do you have enough space in /var/lib/centreon/metrics directory?
Can you check the //var/log/centreon-broker/central-rrd-master.log file?
Hi @Laurent ! Thanks for answering
I think I do have enough space available :
The ‘metrics-old’ folder is just a copy I made while trying to debug
As for central-rrd-master.log, everything seems fine except that one error I found :
“””
core] /info] main: termination request received by process 405433 core] icore] wcore] ntcp] dinfo] TCP stream destroyed. Still 0 configured on a thread pool of 3 threads ttcp] sdebug] Finishing to write data before closing the connection ncore] rcore] rcore] lcore] utcp] 0debug] stop acceptor btcp] serror] Error while reading on socket: Operation aborted. stcp] >info] TCP acceptor interrupted: Operation aborted. bcore] core] tcore] ucore] rcore] lcore] tcore] lcore] tcore] lcore] acore] ncore] core] ecore] core] score] bcore] _core]
“””
I tried reading rrd files and they seem to update according to the values I get in CentreonWeb.
How do you check rrd file? If you move to “Monitoring > Performances > Graphs” can you see them?
Same problem on version 23.04.5, Graphs were working yesterday and now they aren’t. “There’s no data”
I tried researching a bit about rrdtools, I learned that you can see the last value put into the file with
rrdtool last 667.rrd
Anyway, no, I can’t see them anywhere, even when hovering over the graph Icon in ‘Regroupement par hôte’ unfortunately…
There it says “No data available for this period of time”
Hi, are you on Debian?
Where are the owner and groups of /var/log/centreon/rrdtool.log file?
ls -lah /var/log/centreon/rrdtool.log
Hello @Laurent ! Yes I run Centreon on Debian 11.
-rw-r--r-- 1 centreon centreon 0 15 juin 10:24 /var/log/centreon/rrdtool.log
It’s the same as other log files... Should the owner be centreon-engine or centreon-broker ?
I don’t want to hijack the thread but I have the same permissions
Woah how come the logs permission influence the behavior of the graphs ? Alone, I could never have guessed
Thank you so much @Laurent ! @Net ping
Yes the solution also worked for me in both my lab and at work.
Thank you @Laurent and @Yllake
Hi @Yllake, @Net! Huge shout-out to all of you for your contributions, and a special thanks to @Laurent for going above and beyond. We'd love to hear your thoughts on "The Watch" right here. Your feedback is key to leveling up your experience on the platform. Thank you in advance,