Question

Output towards InfluxDB database

  • 6 February 2023
  • 4 replies
  • 478 views

Badge +1

Hi,

I am trying to send some data towards an InfluxDB test database.

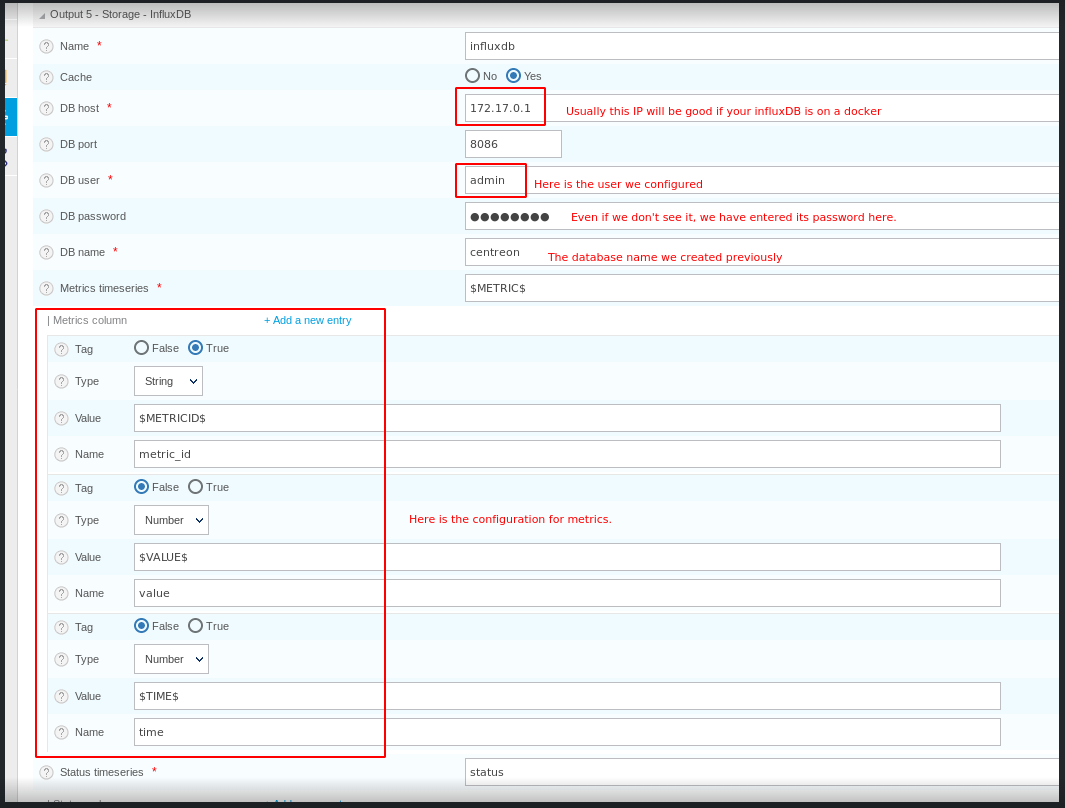
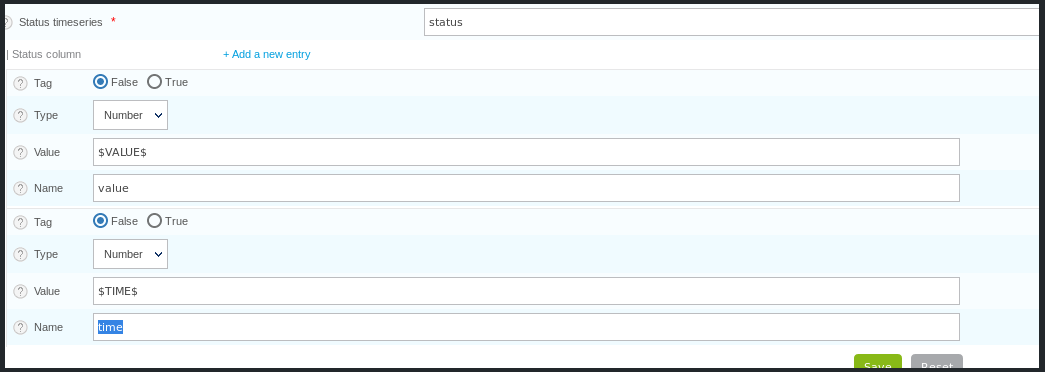
So I naturaly tried to configure a different Output towards the InfluxDB as the option is available on the dropdown menu from the broker configuration (centreon UI).

However, I couldn’t find the documentation on how to configure the output. Some parameters are more explicit than some others.

Does anyone have done it before? Any help would be appreciated.

Regards,

Thierry.


4 replies

Badge

Hi thierryorvoen, 

I’m trying to send data to my influxDB in docker but I can’t find any info or documentation to do it.

were you be able to send metrics to Influx? I was able to send to Graphite but I couldn’t find anything about influxDB.


Badge +1

Hi tetranucleotido,

Nice name by the way ;-)
No, I didn’t manage to do it. I am interested if you got a solution.

Regards,

Userlevel 2
Badge +1

Hi,

Here is a little broker configuration that allows you to write to influxdb.

Several asumptions:

  • influxdb server ip is 172.17.0.1
  • influxdb user is admin
  • we have already a DB instantiated on influxdb named `centreon`.

In your Centreon Web interface, open the broker output configuration. Add a new output of type Influxdb to your central broker. And here is an example of how to fill the form:


For the status part, you can get inspiration from this:

When all these fields are filled, you can push your new configuration and restart broker (to restart broker, use the terminal command `systemctl restart cbd` mandatory because you have a new output), then data should begin to be written into influxdb.

On the broker side, you can open the /var/log/centreon-broker/central-broker-master.log file to verify there are no issue.

On InfluxDB side, you can execute queries to see your data:

> use centreon
> show measurements
> select * from "the name of one of your measurements"

A last important remark, this output needs a cache to be created by broker. To build this cache, broker needs each poller to be restarted.


The previous screenshots are examples, you can customize your output. There are several macros for that:

  • $METRICID$ provides the ID of the metric
  • $INSTANCE$ provides the poller instance name
  • $INSTANCEID$ provides the poller instance ID
  • $HOST$
  • $HOSTID$
  • $SERVICE$
  • $SERVICEID$
  • $METRIC$ provides the metric name
  • $INDEXID$ provides the index ID (a unique ID to represent a host’s service).
  • $VALUE$
  • $TIME$

Hope it helps.

David.

Badge

Thanks for the info. Is there a way to filter data that are sent on InfluxDB ?

Reply