Solved

Show only % in VCSA Datastore-Usage-Global graph

  • 25 July 2024
  • 1 reply
  • 11 views

🇬🇧

Hello,


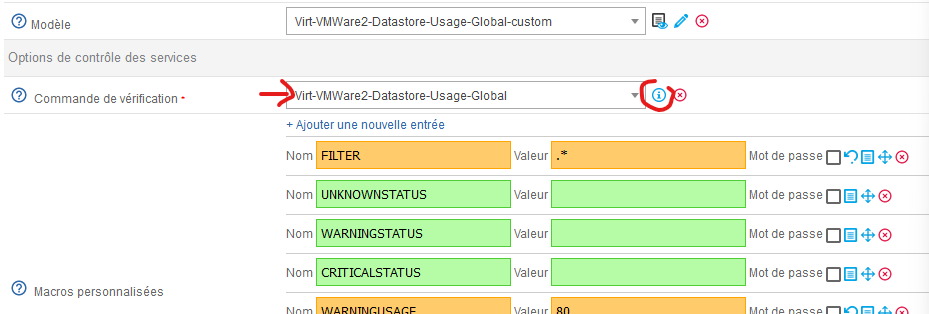
Would it be possible to filter the curves used on the "Datastore-Usage-Global" probe? I have 7 LUNs from a storage array to monitor and some local datastores. However, with the information in bytes (B) free/used and in percentages (%) free/used, it gives me 4 times too much content when I want to use the graph. I just want to have the percentage used curves. And if possible, have everything in the same table; otherwise, I can always generate a graph per metric.

Thanks


🇫🇷

Bonjour,


Est-ce qu’il serait possible de filtrer les courbes utilisés sur la sonde “Datastore-Usage-Global” ? J’ai 7 LUN d’une baie à monitorer et quelques datastores locaux. Sauf qu’avec les informations en octets (B) libre/utilisé et en pourcentages (%) libre/utilisé, ça me fait 4 fois trop de contenu quand je veux me servir du graph. Je veux juste avoir les courbes pourcentage utilisé. Et puis dans la mesure du possible tout avoir dans le même tableau, sinon je peux toujours généré un graph’ par métrique.

Merci

1 reply

🇬🇧

Hello,

After clicking around everywhere, I finally found it ! When you select a verification command (from any service, model or not) and click on the information button, a help window appears with the different available arguments.
 

The argument to add in extraoptions is --filter-perfdata='prct'.

So, I duplicated the service and named it Datastore-Usage-Global-PRCT. It's a duplicate, but I can generate filtered graphs based on the datastore name (FILTER) and on the curves (EXTRAOPTIONS).


🇫🇷

Bonjour,


A force de cliquer partout j’ai fini par trouver ! Quand on sélectionne une commande de vérification (depuis n’importe quel service, modèle ou non) et qu’on clic sur le bouton d’information, une fenêtre d’aide apparait avec les différents arguments disponibles.

L’argument à ajouter dans extraoptions est --filter-perfdata=’prct’.

J’ai donc dupliqué le service en l’appelant Datastore-Usage-Global-PRCT. Ça fait doublon mais je peux générer des graph’ filtré et sur le nom du datastore (FILTER) et sur les courbes (EXTRAOPTIONS).

Reply