
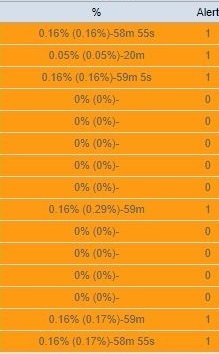
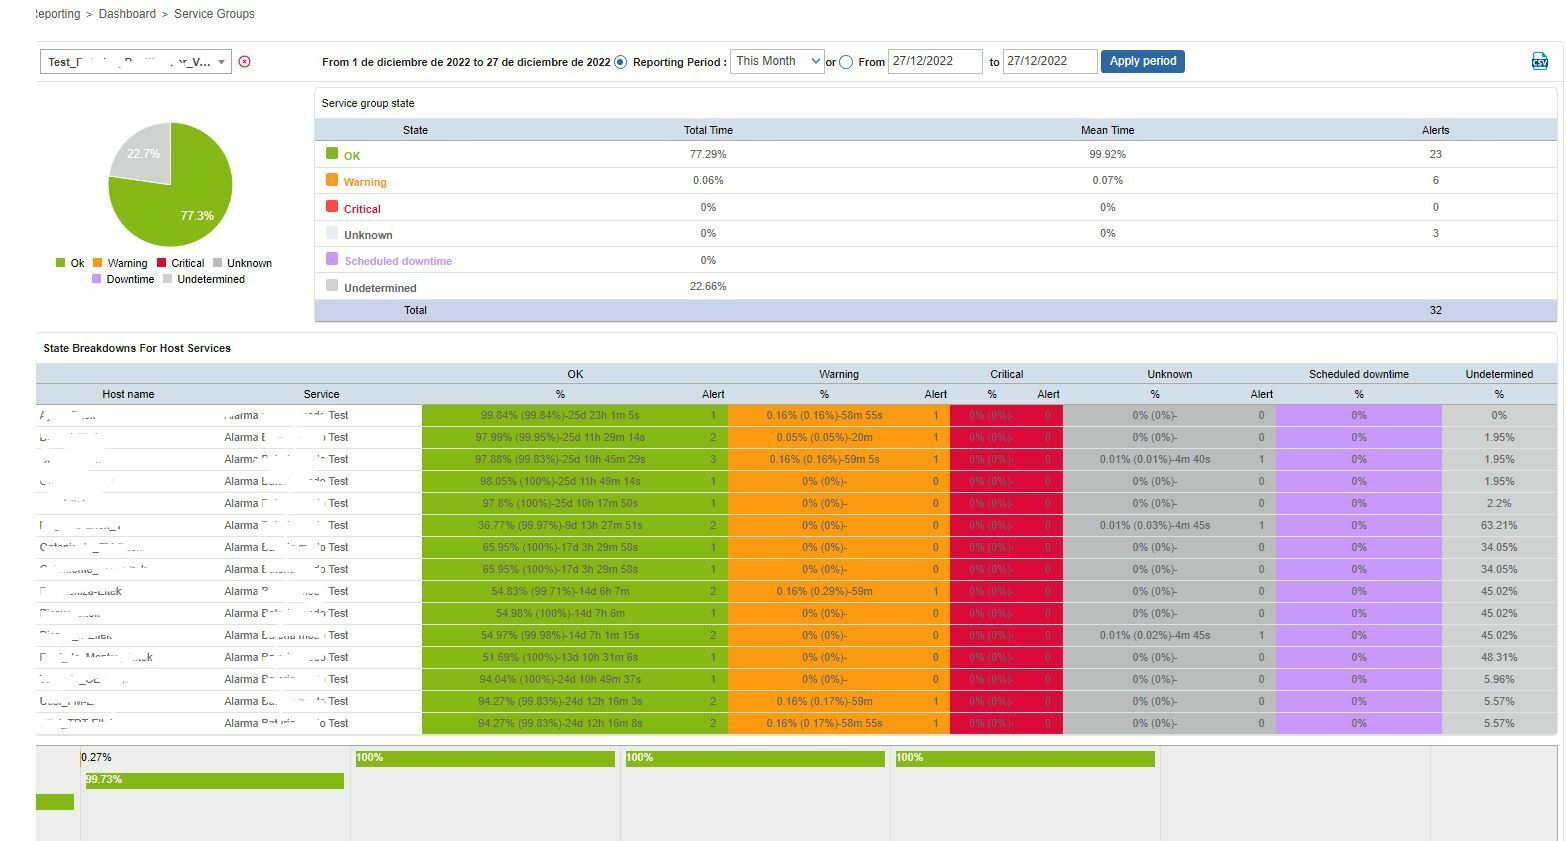
In dashboard I have modified to show the status in time format in service groups.
I see useful that you can show the values in percentage or time, at the same time or with an option check pj in all screens

In dashboard I have modified to show the status in time format in service groups.
I see useful that you can show the values in percentage or time, at the same time or with an option check pj in all screens
Dashboard provides us with a lot of help, but the values in percentage is a bit tricky.
Having values in absolute time allows us to better compare the results.
The idea, Add a switch to see it in percentage or in time, both on the screen and in the export
I have made some modifications in the service group files, which correspond to the captures at the beginning with the data that interests me. It would have to be elaborated better , apply it to all and to export csv
/usr/share/centreon/www/include/reporting/dashboard/template/viewServicesGroupLog.ihtml
from line144:
				<tr class={cycle values="list_two, list_one"}>
					<td class="ListColHeaderLeft">
						<a href="main.php?p=30701&host={$tb.HOST_ID}&period={$get_period}&start={$get_date_start}&end={$get_date_end}">{$tb.HOST_NAME}</a></td>
					<td class="ListColHeaderLeft">
						<a href="main.php?p=30702&host_id={$tb.HOST_ID}&item={$tb.SERVICE_ID}&period={$get_period}&start={$get_date_start}&end={$get_date_end}">{$tb.SERVICE_DESC}</a></td>
					<td {$style_ok}>{$tb.OK_TP}% ({$tb.OK_MP}%)-{$tb.OK_TF}</td>
					<td {$style_ok_alert} >{$tb.OK_A}</td>
					<td {$style_warning}>{$tb.WARNING_TP}% ({$tb.WARNING_MP}%)-{$tb.WARNING_TF} </td>
					<td {$style_warning_alert} style="width:30px;">{$tb.WARNING_A}</td>
					<td {$style_critical}>{$tb.CRITICAL_TP}% ({$tb.CRITICAL_MP}%)-{$tb.CRITICAL_TF}</td>
					<td {$style_critical_alert} style="width:30px;">{$tb.CRITICAL_A}</td>
					<td {$style_unknown}>{$tb.UNKNOWN_TP}% ({$tb.UNKNOWN_MP}%)-{$tb.UNKNOWN_TF}</td>
					<td {$style_unknown_alert} style="width:30px;">{$tb.UNKNOWN_A}</td>
					<td {$style_maintenance}>{$tb.MAINTENANCE_TP}%-{$tb.MAINTENANCE_TF}</td>
					<td {$style_pending}>{$tb.UNDETERMINED_TP}%-{$tb.UNDETERMINED_TF}</td>
				</tr>
No account yet? Create an account
Enter your E-mail address. We'll send you an e-mail with instructions to reset your password.