Solved

Latency detected, check configuration for better optimization

  • 19 September 2022
  • 27 replies
  • 1216 views

Badge +6

Hello,

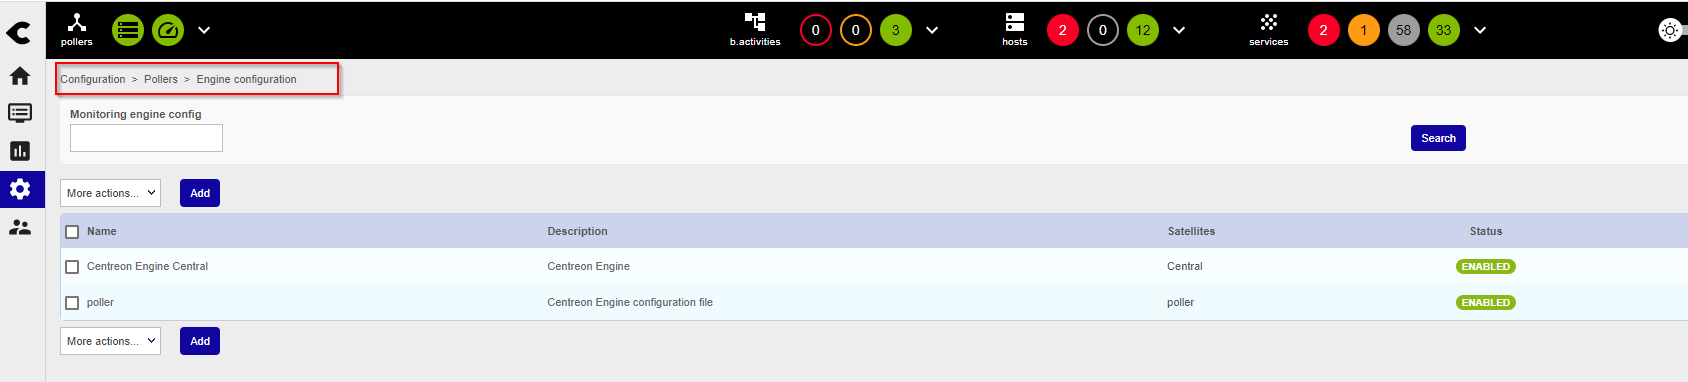
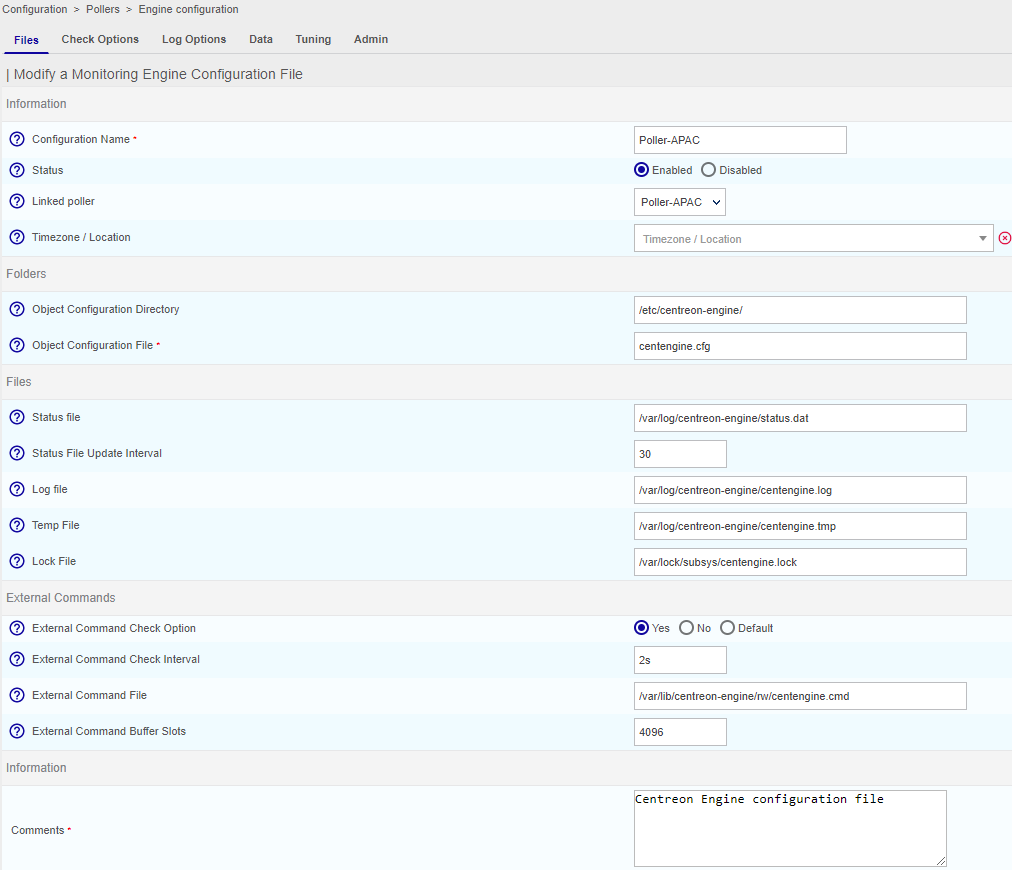
I just finilized installation of Centreon on GCP, my topoligy is 1 central in EMEA and 2 poller 1 in US and another one in Singapore.

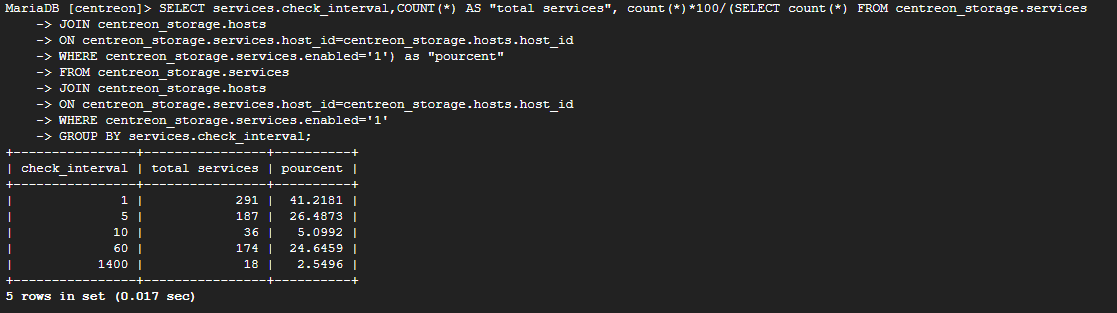
I monitor 1000 hosts and 5000 services.
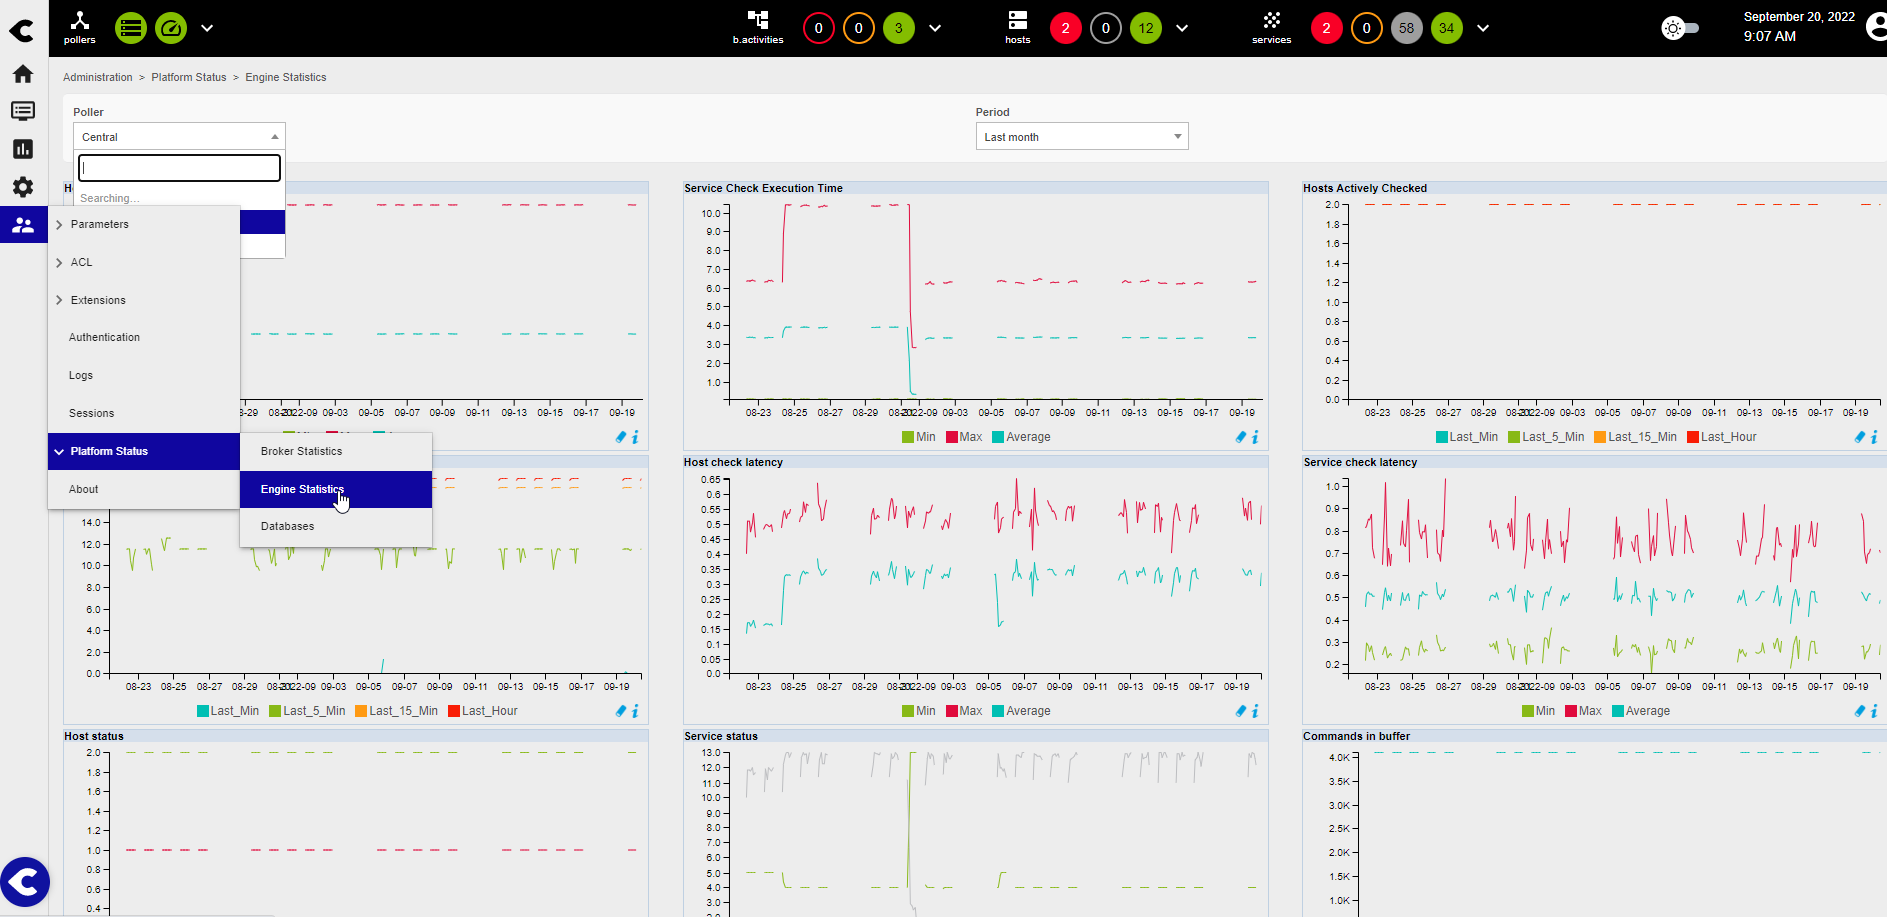
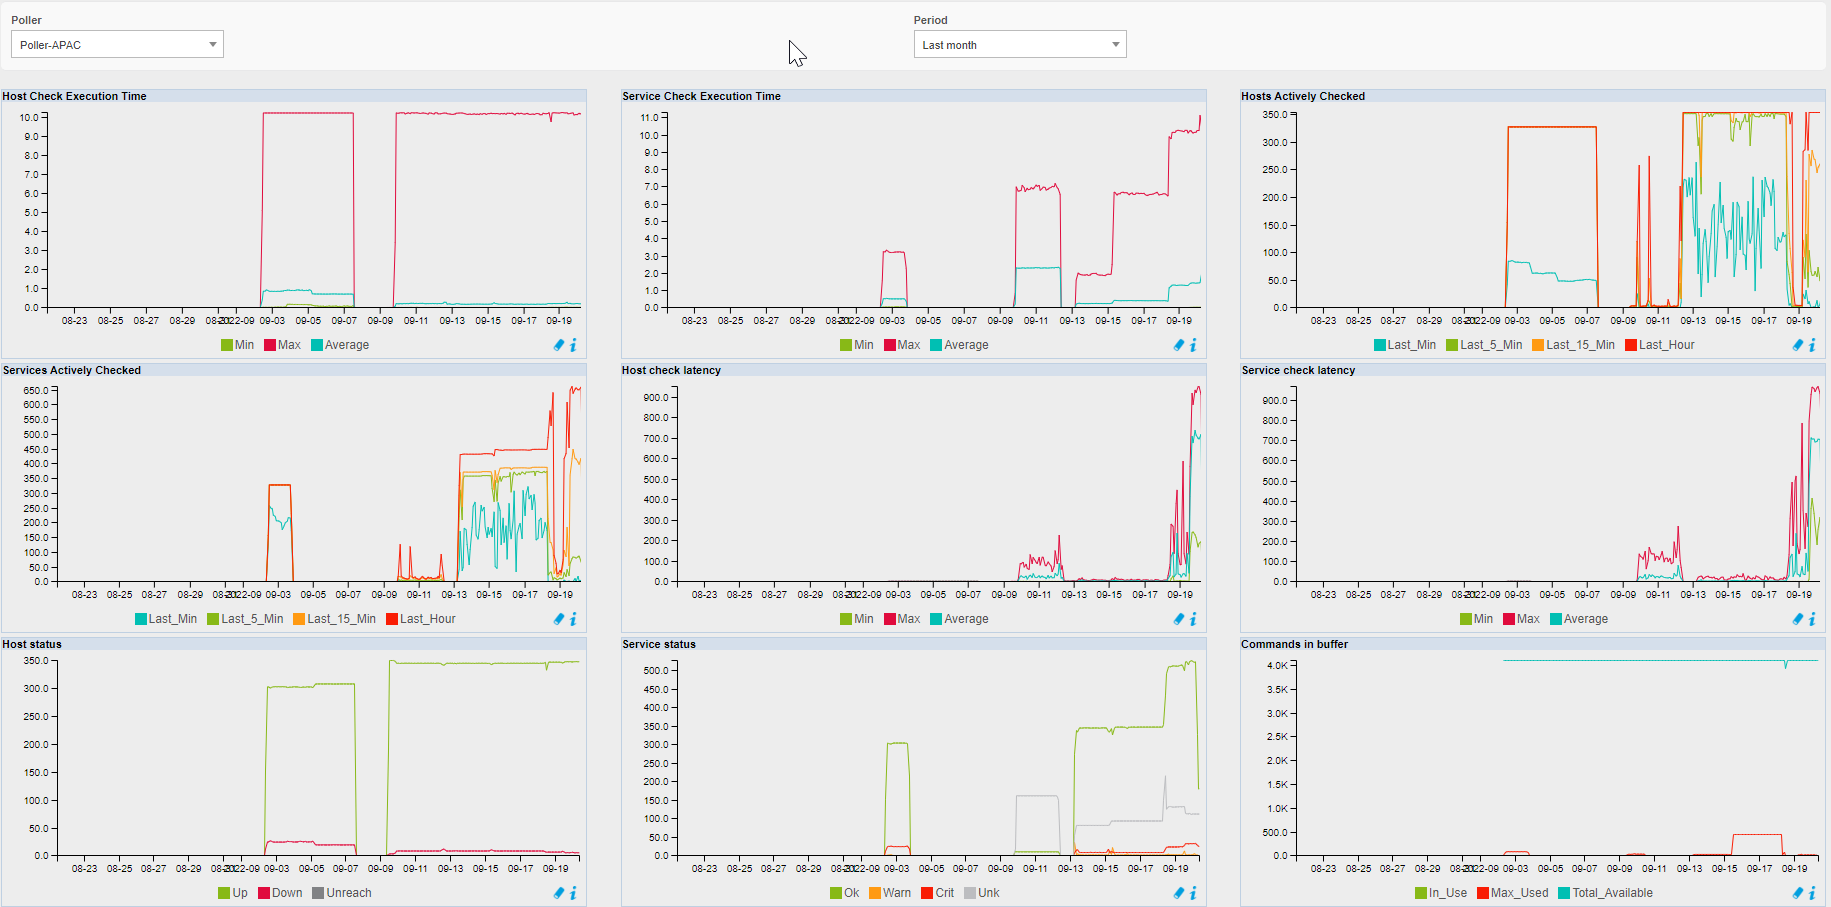
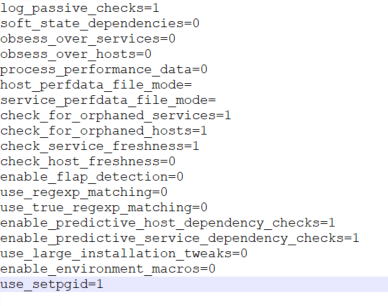
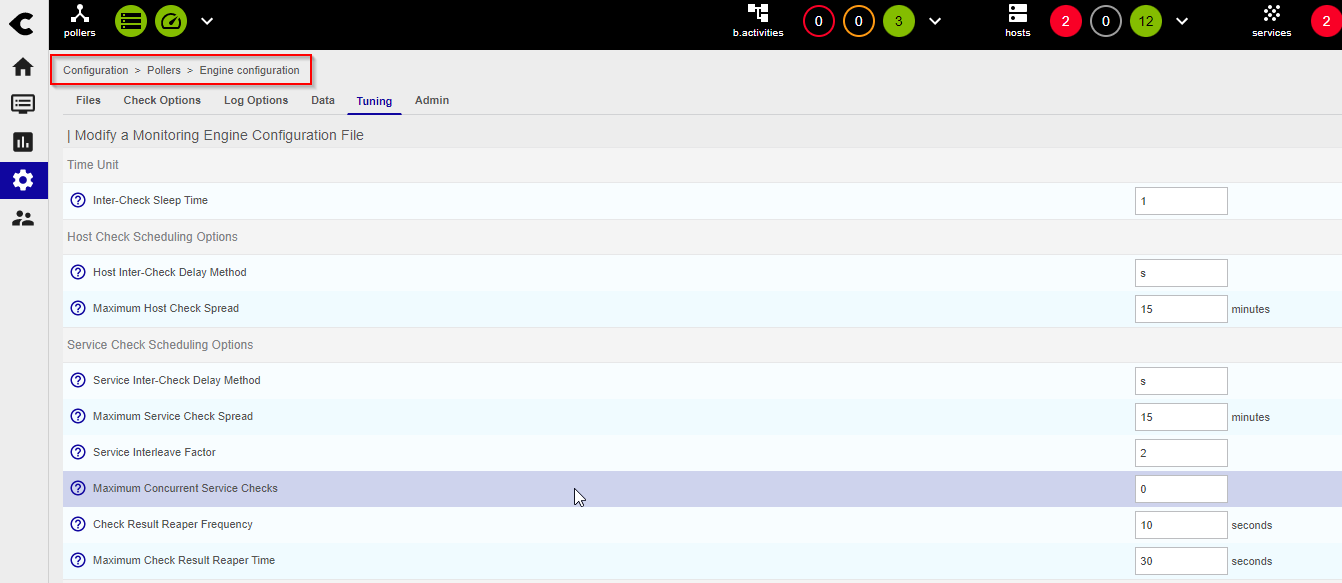
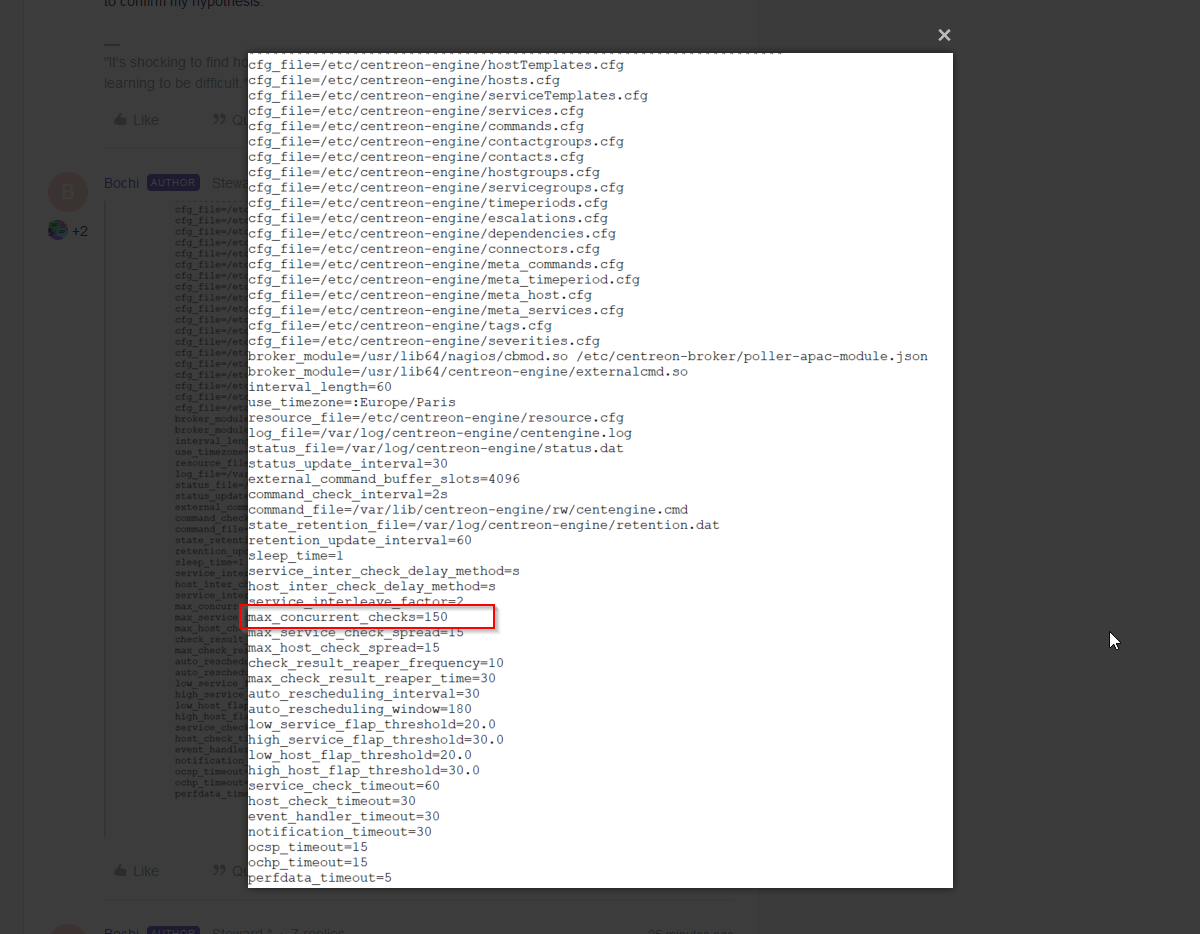
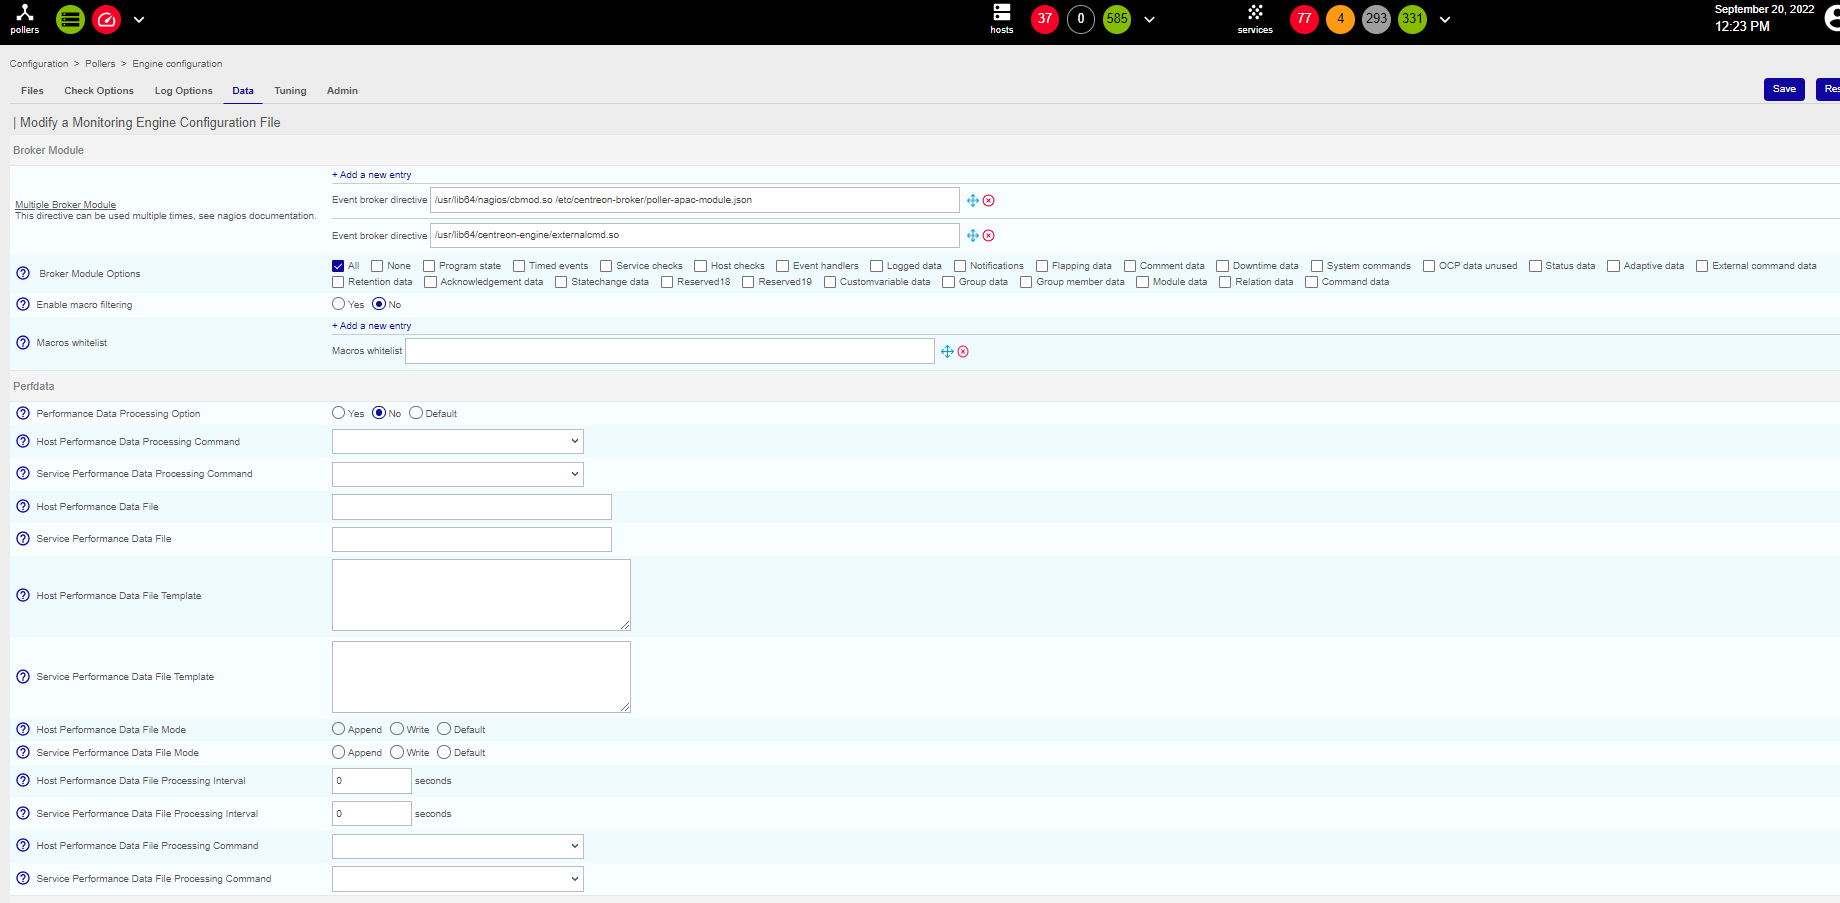
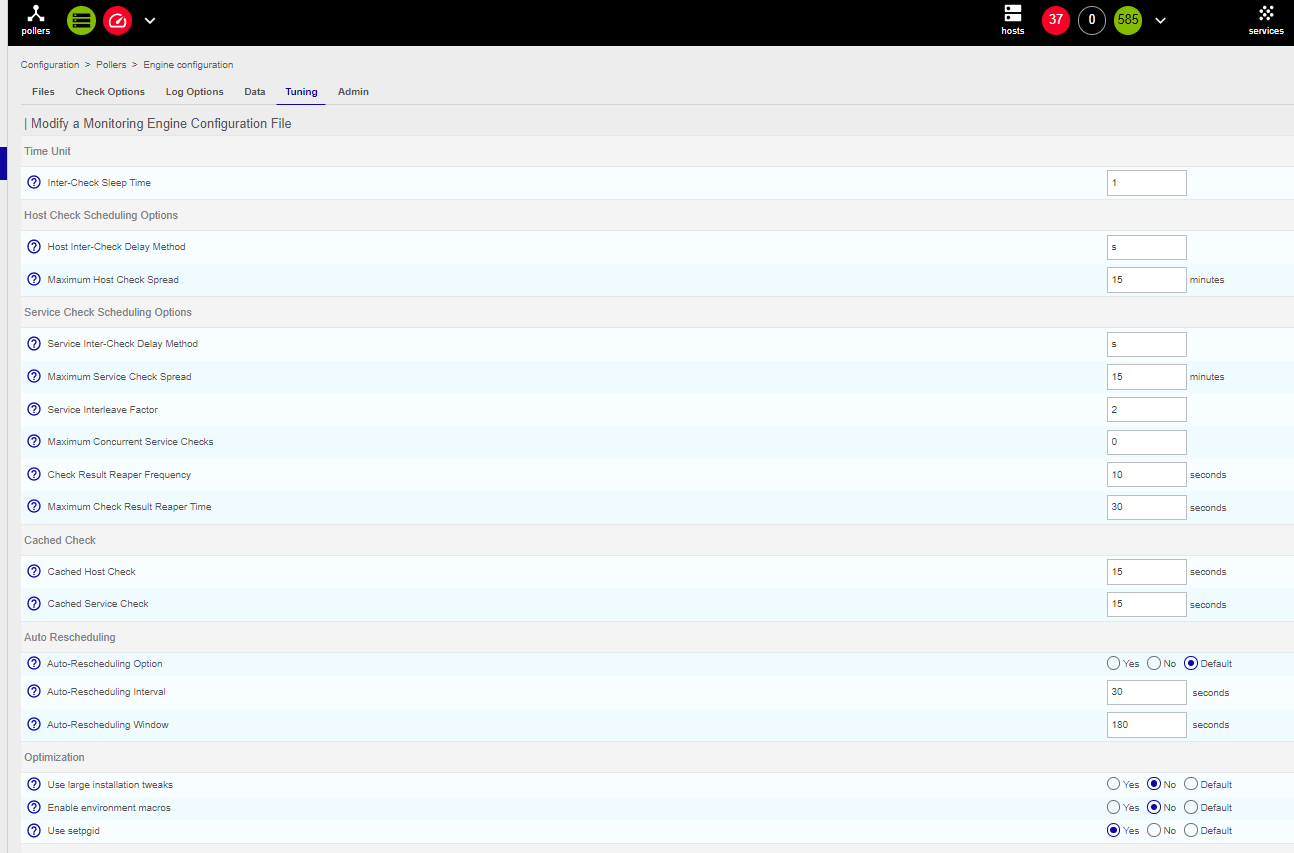
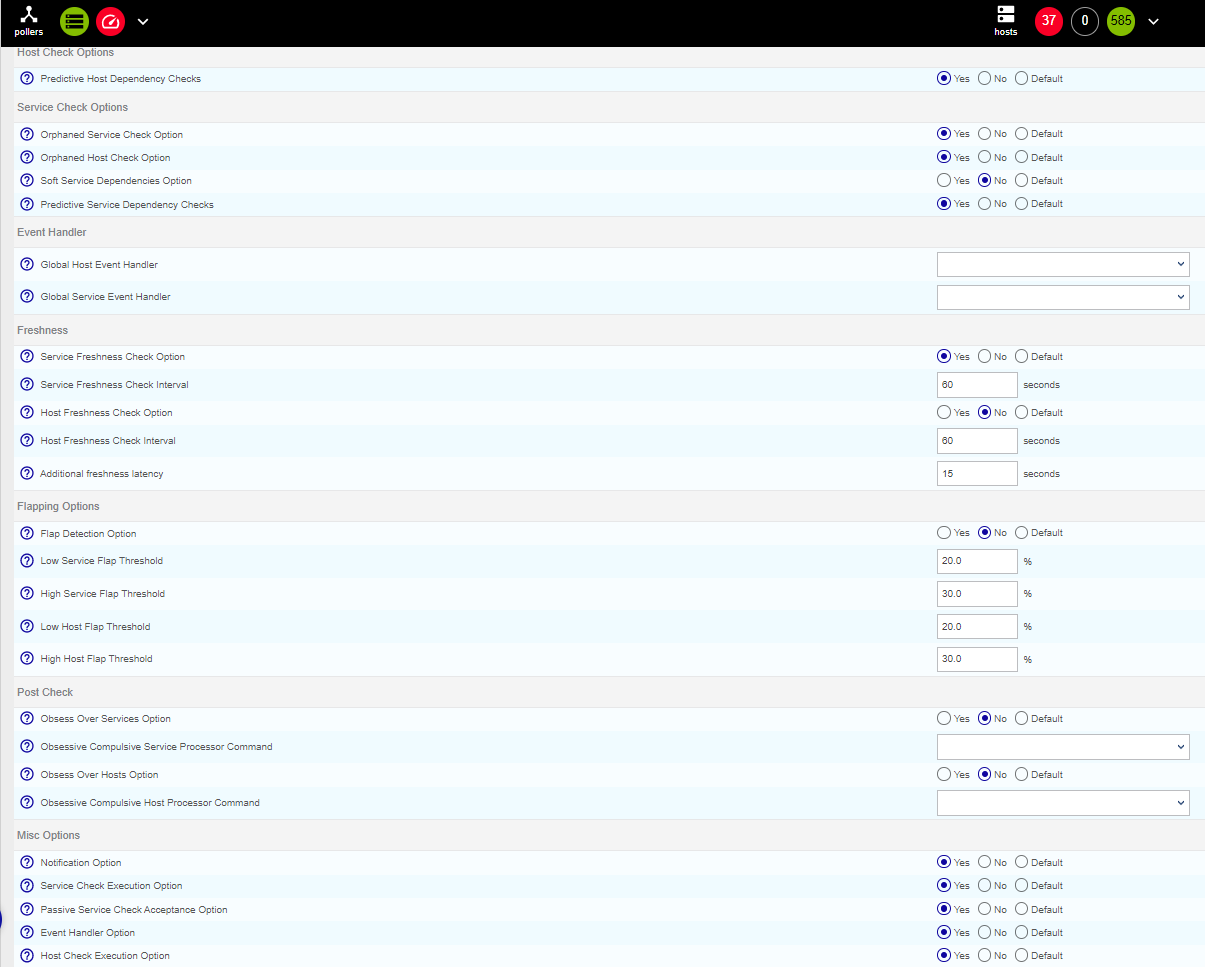
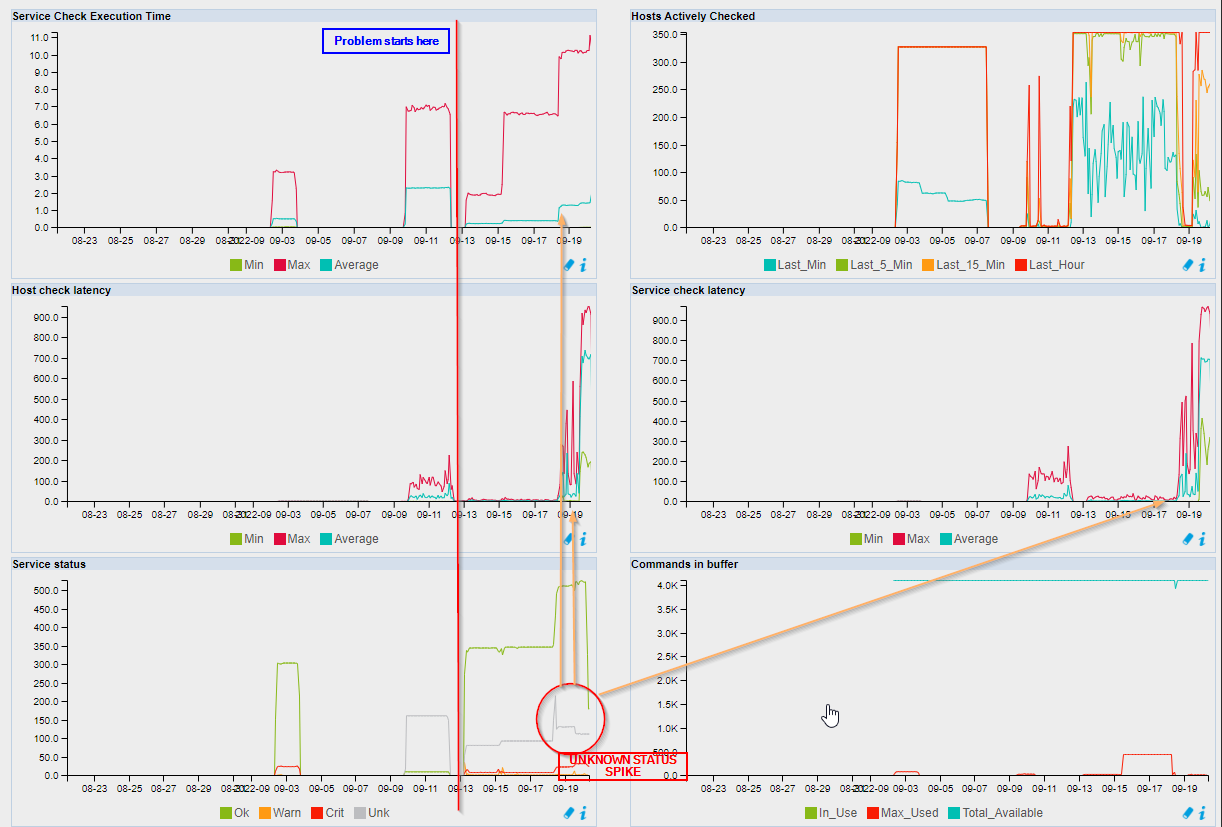
I have an error ‘Latency detected, check configuration for better optimization’, and I see that my graph is not complete…

Help please :)

icon

Best answer by sims24 21 September 2022, 14:35

View original

27 replies

Userlevel 4
Badge +14

Hello @Bochi ,

Just a bunch of idea :

  • Investigate the services who participate to increase the latency (Unknown state, custom check, etc..) use the centreon plugins. A standard approach could reduce it.
  • Use the connector Perl / SSH
  • Add a poller's, to split the load, it's a radical workaround ⚡

But maybe in your case, the latency are at the network level ?


Badge +6

Hello @gespada 

Thanks for your feeback, how can I do to use connector Perl/SSH ?

Regards,

Userlevel 6
Badge +19

Hi @Bochi 


Could you please tell us how servers are sized? GCP Instance size will help.


Before implementing the perl connector, could you share a screenshot of this page for all your pollers? It will help us giving you a better advice.


Badge +6

Hello @sims24 


Details : 


Central : 8vCPU & 16G RAM

Poller : 4vCPU & 8Go RAM


Many thanks !

Userlevel 6
Badge +19

Thanks, that helps. 


Could you share the content or /etc/centreon-engine/centengine.cfg file from the poller-APAC? Just to confirm my hypothesis.

Badge +6


Badge +6

.

Badge +6

@sims24 I’m not able to share file...

Userlevel 6
Badge +19

It worked, got it. Probably a bug from the platform.


Here is what you have to change:


Then deploy/export your configuration for the poller and restart it (not reload!).


You will not have this latency problem anymore.


Cheers


Badge +6

I need to put parameter ‘Maximum Concurrent Service Checks’ at ‘0’ ?

Userlevel 6
Badge +19

Yes, sorry it wasn’t obvious.


This way the engine will schedule check in a smart way regarding other parameters without this constraint of how many it can runs in //.


Your poller is correctly sized, it will be like night and day after changing this.


Just wondering, did you manually change this parameter or does the 150 value came by default?

Badge +6

Yes, following a comment that I saw in another forum.

But it was at 0 and I encoutered same behavior :(

Userlevel 6
Badge +19

Then the problem is about applying the modification, from the file you shared, it is 150:


Userlevel 6
Badge +19

Still, you can share a screenshot from you platform similar to this one:


Also, look for errors in /var/log/centreon-gorgone/gorgoned.log.


Cheers

Badge +6


Badge +6

I have only this error today (only 1 log) :


Userlevel 6
Badge +19

What’s the last modification date of your engine file?


ls -l /etc/centreon-engine/centengine.cfg

Badge +6


Userlevel 6
Badge +19

Could you export your config again and check if the date is updated?


And afterward, give the result of:


grep concurrent /etc/centreon-engine/centengine.cfg

Userlevel 4
Badge +14

Hello @gespada 

Thanks for your feeback, how can I do to use connector Perl/SSH ?

Regards,

Connectors are at the Commands level menu https://docs.centreon.com/docs/monitoring/basic-objects/commands/#connectors

You add a command to the connector, or you could add connector to the command.


Badge +6

@sims24 result is :


Userlevel 6
Badge +19

Hi, 


Still having latency? What does “ps aux | grep centengine” returns?


Could you share the result of these queries on the you db server please:


Check interval: 

SELECT services.check_interval,COUNT(*) AS "total services", count(*)*100/(SELECT count(*) FROM centreon_storage.services 
JOIN centreon_storage.hosts
ON centreon_storage.services.host_id=centreon_storage.hosts.host_id
WHERE centreon_storage.services.enabled='1') as "pourcent"
FROM centreon_storage.services
JOIN centreon_storage.hosts
ON centreon_storage.services.host_id=centreon_storage.hosts.host_id
WHERE centreon_storage.services.enabled='1'
GROUP BY services.check_interval;


Long lasting checks:

SELECT name, description, s.execution_time, 
CASE WHEN s.state = 0 THEN "OK"
WHEN s.state = 1 THEN "WARNING"
WHEN s.state = 2 THEN "CRITICAL"
WHEN s.state = 3 THEN "UNKNOWN" END AS state
FROM centreon_storage.services s LEFT JOIN centreon_storage.hosts h ON h.host_id = s.host_id
WHERE s.execution_time > 30
AND s.enabled = 1
AND s.last_check > UNIX_TIMESTAMP(SUBDATE(NOW(), INTERVAL 2 DAY));


Badge +6


Userlevel 6
Badge +19

Hum, OK, you’re using 1 minutes interval for many checks. 


The big picture is that you got a UNKNOWN spike, generating a very high load at the engine level. Let me explain, when the engine detects a failure on a service, it will recheck it x times (max check attemps) every x timeframe (retry check interval). 


This UNKNOWN spike generated a lot of recheck and then the scheduler started to drown under all this extra work (I suspect that when it happens, max_concurrent_check was set to 150). 

You can clearly see this on your screenshot: 


Nevertheless, several things look strange: 

  • The number of command in buffer (bottom right), did you massively force check, acknowledge or any handler actions when the problems showed up? This might have make the situation even worse
  • The service check latency is too high according to your poller sizing and the number of services it checks (even if using 1 minutes interval, you should be able to check at least 1K services)
  • I can’t tell if the fall of the OK status curve (in Service statuts graph) is because you disabled some checks of if even more checks returnes UNKNOWN which could explain why you still experience high latency situation 


Try the connector as @gespada proposed, but I’m not convince that it will solve the problem. You will probably save some CPU cycle and by extension scheduler time, but not sure it will be enough in such situation. 


Give me some time to better understand what could go wrong here. 

Badge +6

Many thanks for you explaination !!!

Ok, fisrtly I will reduce the number of the UNKNOWN status, it is a fresh install and i need to configure new IP on all devices.

Regarding the other connector, when I trie to use perl I have this error :


Reply