I’m running centreon version 2.8.26 and 2 poller running version 18.10
I know my version is old but was working.
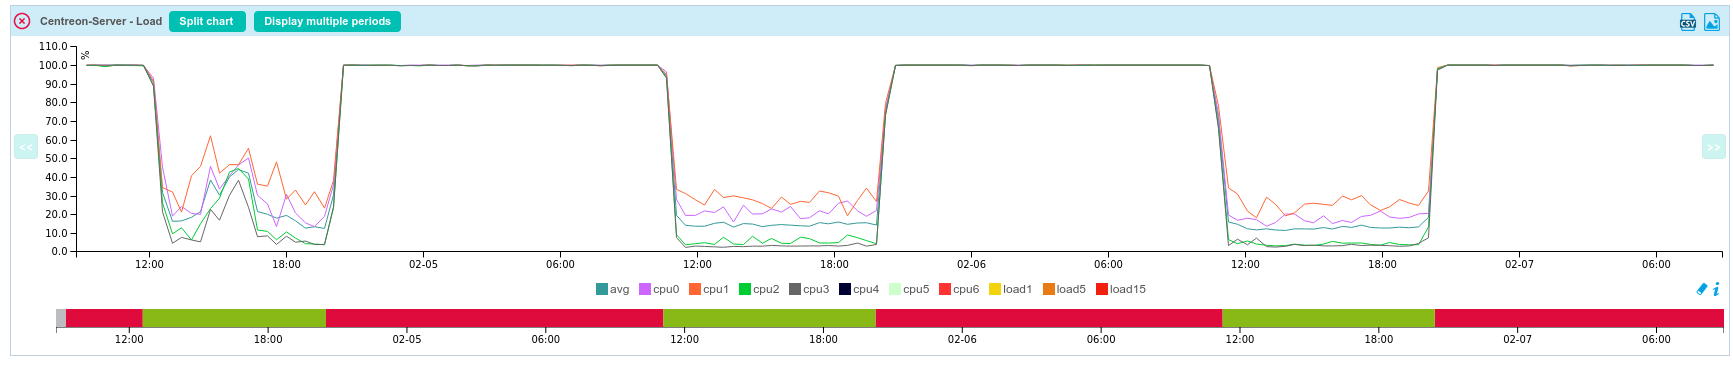
Recently cpu load increase every day from 20h to 11h.
Top indicate cpu usage came from mysqld
From mysql show full processlist I can see following sql queries during high CPU load
This queries seems to proceed in loop
Do you what feature or configuration can cause this kind of SQL query that look very complicated
| 407559 | centreon | localhost | centreon_storage | Query | 16 | Sending data | SELECT h.host_id, h.name, h.address, s.checked as has_been_checked, s.description as service_description, s.display_name, s.display_name as alias, s.notes, s.check_command, s.perfdata, s.output, s.state as current_state, s.last_check, s.next_check, s.state_type, s.check_attempt as current_check_attempt, s.max_check_attempts, s.last_state_change, s.last_hard_state, s.last_hard_state_change, s.acknowledged as problem_has_been_acknowledged, d.start_time as downtime_start, d.end_time as downtime_end, d.author as downtime_author, d.comment_data as downtime_data FROM services s LEFT JOIN hosts h ON s.host_id=h.host_id LEFT JOIN downtimes d ON (d.host_id = h.host_id AND d.service_id=s.service_id AND d.start_time < UNIX_TIMESTAMP() AND d.end_time > UNIX_TIMESTAMP() AND d.deletion_time IS NULL) WHERE (d.downtime_id IS NULL OR d.downtime_id IN ( SELECT MAX(d.downtime_id) as downtime_id FROM downtimes d where d.host_id = h.host_id AND d.service_id = s.service_id AND d.start_time < UNIX_TIMESTAMP() AND d.end_time > UNIX_TIMESTAMP() AND d.deletion_time IS NULL ) ) AND s.host_id = h.host_id AND s.enabled = 1 AND h.enabled = 1
Page 1 / 1
I have checked centreon_storage database integrity and corrected some error but issue is still there
My bet would be that you trigger a lot of downtimes around 6 p.m.
Then, this cron execution takes a lot of time to retrieve the list of downtimes to apply at this time:
/usr/share/centreon/cron/downtimeManager.php
Could you share the content of this log:
/var/log/centreon/downtimeManager.log
How to move forward on this … First, please share the result of the following queries:
SELECT count(*) FROM centreon_storage.downtimes
Then, the oldest entry in the table:
SELECT min(entry_time) FROM downtimes WHERE entry_time IS NOT NULL;
Also, I see some difference on the unique key between my platform and yours, maybe an interesting test would be to align the schema with latest centreon version. Here are the steps you should take:
ALTER TABLE downtimes
  DROP INDEX entry_time,
  ADD UNIQUE KEY `entry_time` (`host_id`,`service_id`,`entry_time`,`instance_id`,`internal_id`);
Then try to run manually the query and check if it still generates high load on the server again:
SELECT
            h.host_id,
            h.name,
            h.address,
            s.checked as has_been_checked,
            s.description as service_description,
            s.display_name,
            s.display_name as alias,
            s.notes,
            s.check_command,
            s.perfdata,
            s.output,
            s.state as current_state,
            s.last_check,
            s.next_check,
            s.state_type,
            s.check_attempt as current_check_attempt,
            s.max_check_attempts,
            s.last_state_change,
            s.last_hard_state,
            s.last_hard_state_change,
            s.acknowledged as problem_has_been_acknowledged,
            d.start_time as downtime_start,
            d.end_time as downtime_end,
            d.author as downtime_author,
            d.comment_data as downtime_data
            FROM services s
            LEFT JOIN hosts h
                ON s.host_id=h.host_id
            LEFT JOIN downtimes d
                ON (d.host_id = h.host_id AND d.service_id=s.service_id AND d.start_time < UNIX_TIMESTAMP() AND d.end_time > UNIX_TIMESTAMP() AND d.deletion_time IS NULL)
            WHERE (d.downtime_id IS NULL OR d.downtime_id IN (
                            SELECT MAX(d.downtime_id) as downtime_id
                                FROM downtimes d where d.host_id = h.host_id AND d.service_id = s.service_id AND d.start_time < UNIX_TIMESTAMP() AND d.end_time > UNIX_TIMESTAMP() AND d.deletion_time IS NULL
                            )
                  )
               AND s.host_id = h.host_id AND s.enabled = 1 AND h.enabled = 1
Kill it after one minute if you see that it takes forever and generates high load on your server.
Kind regards
Hi
Thanks again for your great responses and time allocated to my issue!
Appreciate a lot !
downtimeManager.log not modified until 2017… strange !
MariaDB M(none)]> SELECT count(*) FROM centreon_storage.downtimes; +----------+ | count(*) | +----------+ | 1294073 | +----------+ 1 row in set (0.15 sec)
MariaDB >(none)]> SELECT min(entry_time) FROM downtimes WHERE entry_time IS NOT NULL; ERROR 1046 (3D000): No database selected MariaDB >(none)]> SELECT min(entry_time) FROM centreon_storage.downtimes WHERE entry_time IS NOT NULL; +-----------------+ | min(entry_time) | +-----------------+ | 1496410462 | +-----------------+ 1 row in set (0.22 sec)
After updating schema request is about 8 time faster
If I understand correctly downtime table is just an history of all downtime that where created ?
Can I simply empty this table to have only new one ?
What is usage of keeping all downtime ? first entry has 1496410462 as timestamp (02/06/2017)
Regards
bellow last log of /var/log/centreon/downtimeManager.log (2017)
PHP Notice: Undefined index: 67 in /usr/share/centreon/www/class/centreonGMT.class.php on line 373 PHP Notice: Undefined index: 67 in /usr/share/centreon/www/class/centreonGMT.class.php on line 373 PHP Notice: Undefined index: 67 in /usr/share/centreon/www/class/centreonGMT.class.php on line 373
user apache associate to downtimeManager cron entry has nologin associated in /etc/passwd
apache48:48:Apache:/var/www:/sbin/nologin
I tried to manually run /usr/bin/php -q /usr/share/centreon/cron/downtimeManager.php >> /var/log/centreon/downtimeManager.log 2>&1 but nothing added to log file using (centreon user or root)
Glad to hear that the query is faster with the modified UNIQUE_KEY.
Not to worry, if the file hasn’t been modified it means it ran without errors.
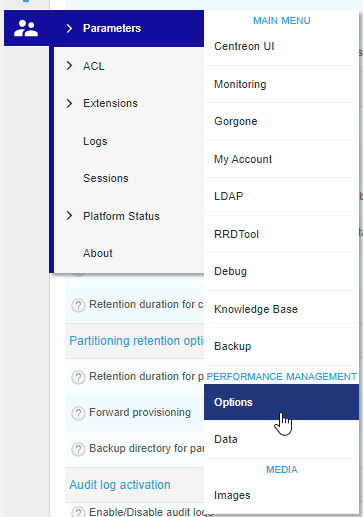
I suppose you can define a purge for this table here (menus might be slightly different with your version):
And configure the number of days you want to keep:
A cron will apply this new parameter over the night and everything will work more efficiently starting from there.
Thanks again for your quick reply
I have launched manually /usr/share/centreon/cron/centstorage_purge.php
Now I have queries is about 30 time faster
I will see if load increase this evening and let you know


 48:48:Apache:/var/www:/sbin/nologin