Hello,
We have created a custom script that generates certain perfdata:
OK: runningPiTcpSocketFibers < 200 | 'runningPiTcpSocketFibers-1'=2;;0:200;0; 'runningPiTcpSocketFibers-2'=2;;0:200;0;
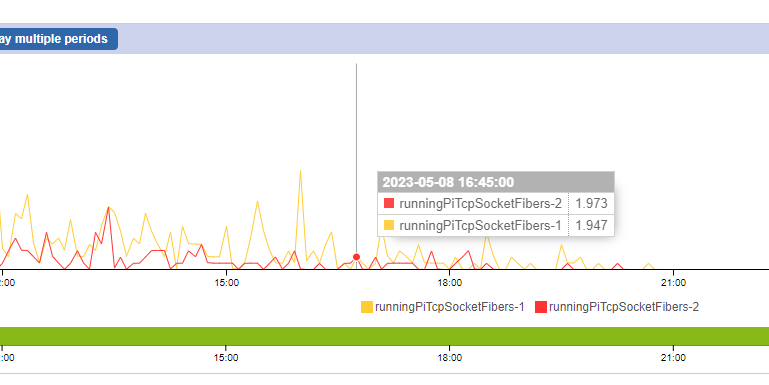
The problem is that the values of the perfdata that should be 2 and 2 when they appear in the graphs come out with decimals and not as integer values. We don't understand where those values come from or what calculations you are doing to get them.

We have tried to configure it through Monitoring > Performances > Curves but we have not succeeded either.
Can you help us?
Best regards,


