In the observability era, many metrics are collected on various devices. Sometimes, metrics gathered from a Centreon Host are even more interesting when compared to or associated with others.
This tutorial will guide you through creating a single check aggregating metrics from multiple Hosts and Services.
The Centreon SQL Metrics Plugin Pack offers a handy service template: App-Monitoring-Centreon-SQL-Virtual-Curves-custom. This template will help you configure such a check.
The idea behind it is to offer an alternative to the good old meta services which have several limitations, as an example they:
- cannot make the output human-readable
- cannot do advanced calculations on multiple metrics
- cannot be used efficiently in Business edition modules.
Concepts
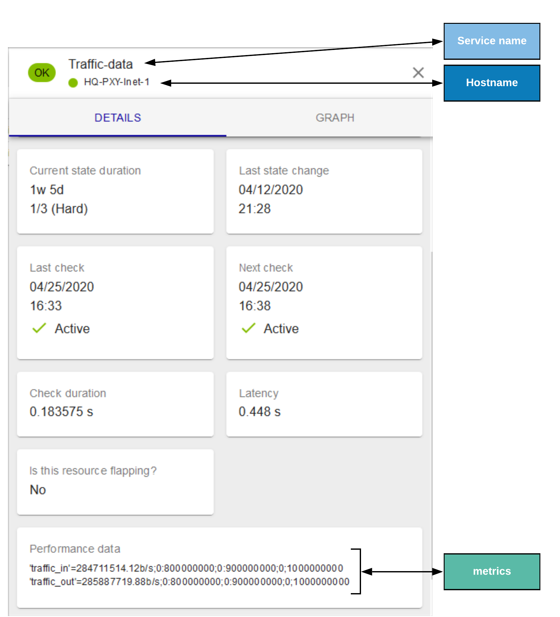
This screenshot of a detailed Service page highlights the main monitoring concepts you must understand to avoid getting lost during this tutorial. Pretty simple right?
Use cases
Here are some examples of what we've done so far with our community users and customers:
- Sum different network devices bandwidth utilization (example: incoming or outgoing traffic of a specific network zone)
- Sum storage utilization (Space used or provisioned across all your VMWare datastores)
- Get average, min, max of individual Services' metrics (example: connected users or license usage)
- Perform specific mathematical operations on metrics to create new ones (example: Convert power usage into CO2 emanation)
- Display within the same service or graphs curves generated by several others
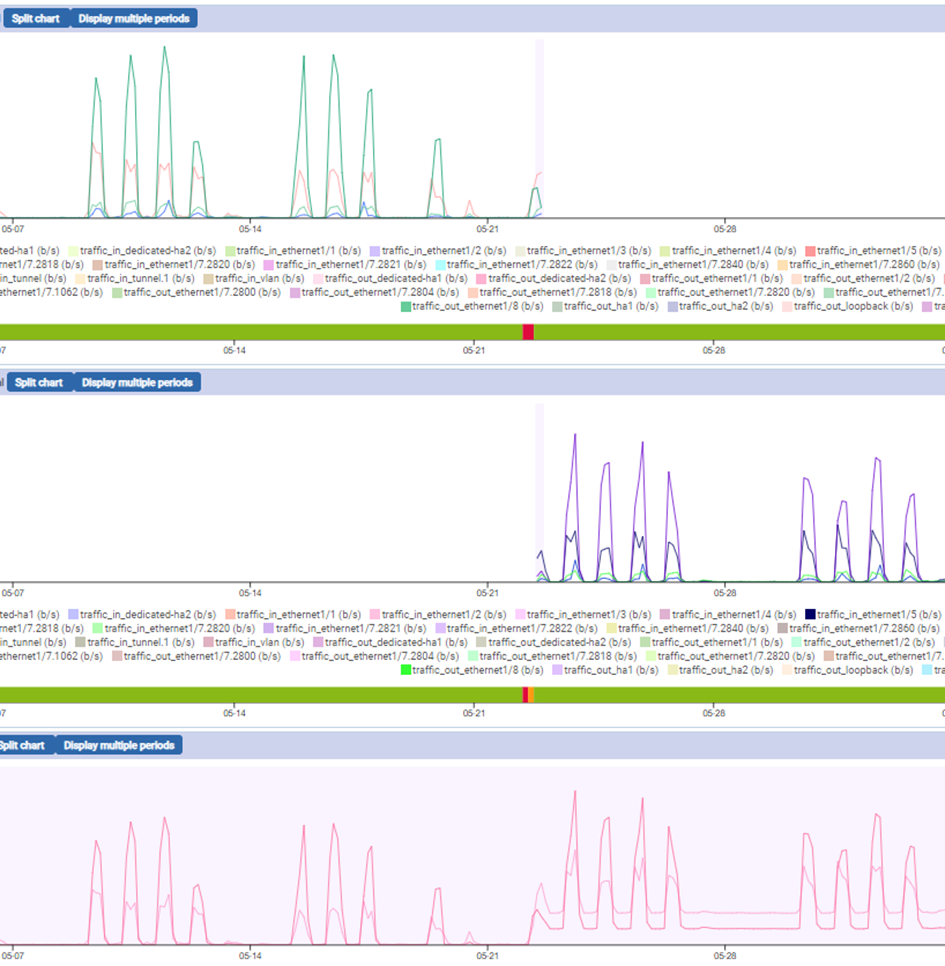
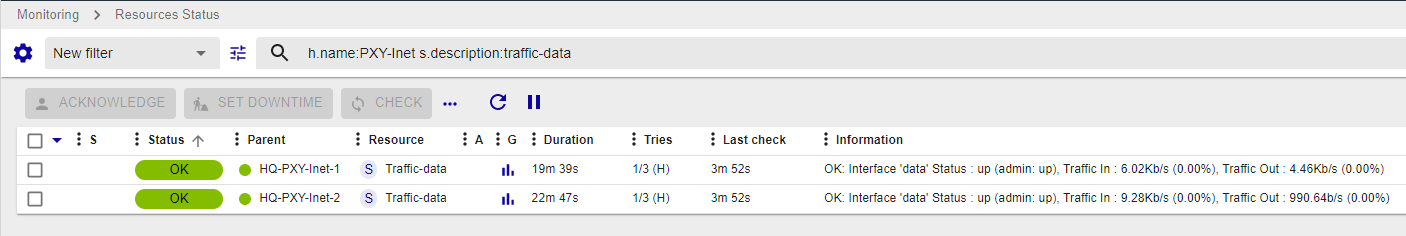
In this tutorial, we will see how we can sum the total bandwidth going through the data interface of both nodes of my proxy cluster users configure to access internet:
How it works?
Before going deeper in the use case, you probably wonder how it works behind the scene.
The plugin connects to the Centreon database and reads a configuration file to perform advanced computing on metrics.
It uses the database to fetch metrics' current values during its execution.
The configuration file defines:
- Which Hosts, Services, Metrics the plugin should consider?
- How to mould raw metrics?
- How to output the result?
Configuration file
Here is a complete configuration file to get a global idea of the layout. We will then look closer at each part and how directives enable some plugin features.
{
"selection": {
"traffic_in_node_1": {
"host_name": "HQ-PXY-Inet-1",
"service_name": "Traffic-data",
"metric_name": "traffic_in",
"display": false
},
"traffic_in_node_2": {
"host_name": "HQ-PXY-Inet-2",
"service_name": "Traffic-data",
"metric_name": "traffic_in",
"display": false
},
"traffic_out_node_1": {
"host_name": "HQ-PXY-Inet-1",
"service_name": "Traffic-data",
"metric_name": "traffic_out",
"display": false
},
"traffic_out_node_2": {
"host_name": "HQ-PXY-Inet-2",
"service_name": "Traffic-data",
"metric_name": "traffic_out",
"display": false
}
},
"virtualcurve": {
"sum_traffic_in": {
"pattern": "^traffic_in$",
"aggregation":"sum"
},
"sum_traffic_out": {
"pattern": "^traffic_out$",
"aggregation":"sum"
}
},
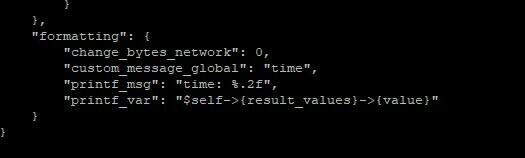
"formatting": {
"change_bytes_network": 1,
"custom_message_global": "Traffic on data interfaces is OK",
"printf_msg": "Incoming traffic SUM is: %s %s/s",
"printf_var": "$self->{result_values}->{value}, $self->{result_values}->{unit}"
}
}
Basic use
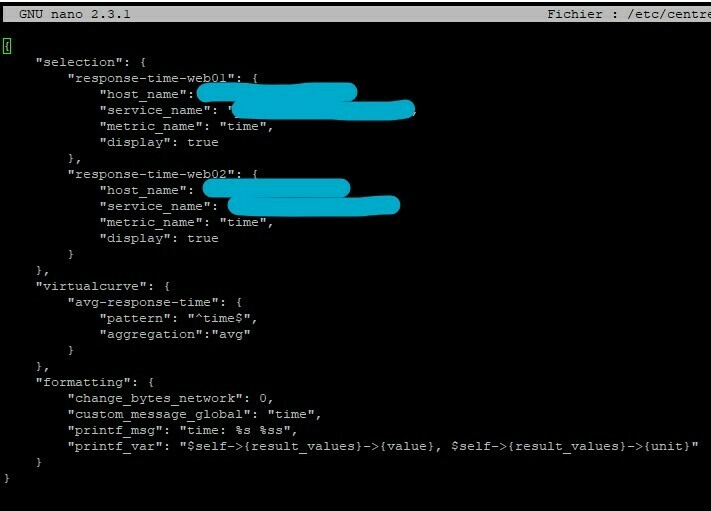
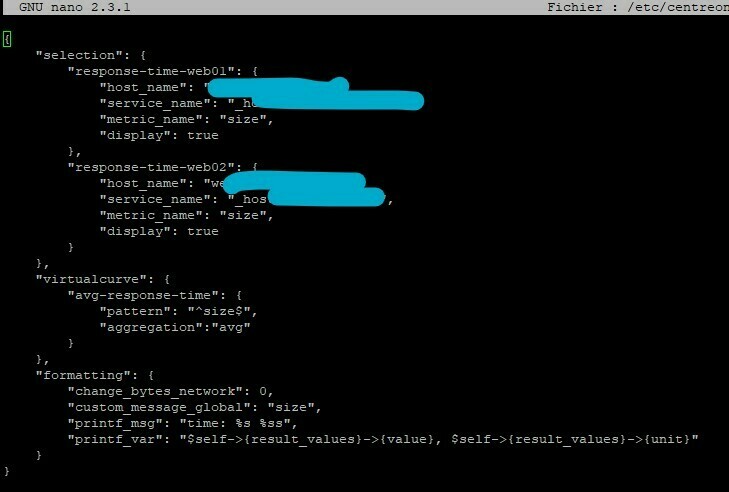
The "selection" JSON node is meant to describe metrics to be selected:
- "traffic_*node_1" & "traffic_*node_2" are selection identifiers. Both have their keys:
- "host_name": The exact hostname in Centreon
- "service_name": The exact service name in Centreon
- "metric_name": The metric name (you can use a POSIX regex filter)
- "display": Define if this metric should create a dedicated curve.
The "virtualcurves" JSON node is meant to describe the new curves to add created:
- "sum_traffic_in" & "sum_traffic_out" are virtual curves identifiers. Both have their keys:
- "pattern": Pattern to process a part of previously selected metrics inside the virtual curve. Here we use a regex to match exactly a metric name.
- "aggregation": Aggregation you want to apply. Possible values are: 'min', 'max,' 'sum', 'avg' or 'none'. Here we will sum value from the two metrics matching the pattern.
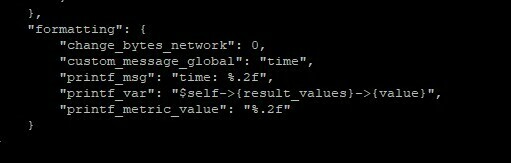
The “formatting” sub-section defines the plugin output
- "change_bytes_network": Use base 1000 to convert metric result to a human-readable format. You can use change_bytes instead if you deal with storage volumes.
- "printf_msg": Printf expression, if you want to handle advanced data type you may want to read this but it will work with ‘%s’ to substitue value as a string
- "printf_var": Scalar to use within Printf substitution. Stick to the example as they are the only ones available at the moment. If you don’t need to set change_bytes to true, simply remove “, $self->{result_values}->{unit}”.
Advanced use
The "selection" JSON node may be substituted by a "filters" one. It allows SQL '%' wildcard utilization and makes the configuration much simpler.
        "filters": {
                "host": "HQ-PXY-Inet%",
                "service": "Traffic-data",
                "metric": "traffic_%",
                "display": false
        },
Please note the differences in the name of the keys:
* "host": Hostname filter
* "service": Service filter
* "metric": Metric filter
Setup and practice
Prerequisites
The configuration file must be readable by the centreon-engine user.
The Poller executing the check must be able to connect to the centreon_storage database over 3306/TCP port with values supplied through --username and --password options.
The SQL user must hold required privileges to "SELECT" data within index_data and metrics tables part of the centreon_storage database.
Installation
Create a directory to store your config files:
mkdir /etc/centreon-engine/virtual-curve-cfg/Set the centreon-engine user as owner of this directory
chown centreon-engine. /etc/centreon-engine/virtual-curve-cfg/Install the Plugin Pack:
- Install the Plugin code on the Central or/and a Poller
yum install centreon-plugin-Applications-Monitoring-Centreon-SQL-Metrics
2. Install the 'Centreon SQL Metrics" Plugin Pack through "Configuration > Plugin packs > Manager" page. Note that if you use an offline licence you will need to issue this command on your central server to see it listed:
yum install centreon-pack-applications-monitoring-centreon-sql-metrics
Plugin execution
You can execute the plugin like this:
/usr/lib/centreon/plugins/centreon_centreon_sql_metrics.pl \
--plugin=database::mysql::plugin \
--dyn-mode=apps::centreon::sql::mode::virtualservice \
--host='127.0.0.1' \
--username='<your-db-user>' \
--password='<your-db-passwd>' \
--config-file=/etc/centreon-engine/virtual-curve-cfg/proxy-sum-data.json' \
--verbose
Here is the result of the previous execution:
OK: Traffic on data interfaces is OK | 'sum_traffic_in'=102394;;;; 'sum_traffic_out'=66941;;;;
Incoming traffic SUM is: 102.39 Kb/s
Incoming traffic SUM is: 66.94 Kb/s
As every other plugin, you can add the ```--help``` flag to see all available options.
It's possible to set WARNING and CRITICAL thresholds with these options:
--warning-metric and --critical-metric
--warning-global and --critical-global
Going further and how modifications on the config reflect on the plugin behavior?
Let's modify the configuration file and see what it changes.
- Set display as true in your filters section. Note that all selected metrics are now visible in the verbose output:
Your "filters" section then looks like this:
        "filters": {
                "host": "HQ-PXY-Inet%",
                "service": "Traffic-data",
                "metric": "traffic_%",
                "display": true
        },
Plugin execution now produces the output shown below and display details for each metrics:
OK: Traffic on data interfaces is OK - All metrics are OK | 'sum_traffic_in'=113765;;;; 'sum_traffic_out'=63588;;;; 'HQ-PXY-Inet-1#Traffic-data#traffic_in'=105291b/s;;;0;1000000000 'HQ-PXY-Inet-1#Traffic-data#traffic_out'=53946.2b/s;;;0;1000000000 'HQ-PXY-Inet-2#Traffic-data#traffic_in'=8474.08b/s;;;0;1000000000 'HQ-PXY-Inet-2#Traffic-data#traffic_out'=9642b/s;;;0;1000000000
Incoming traffic SUM is: 113.77 Kb/s
Incoming traffic SUM is: 63.59 Kb/s
Metric 'HQ-PXY-Inet-1#Traffic-data#traffic_in' value is '105.29'
Metric 'HQ-PXY-Inet-1#Traffic-data#traffic_out' value is '53.95'
Metric 'HQ-PXY-Inet-2#Traffic-data#traffic_in' value is '8.47'
Metric 'HQ-PXY-Inet-2#Traffic-data#traffic_out' value is '9.64'
Adding a “formatting” subsection in the “filters” node will allow to display the traffic of each interface in a readable format:
OK: Traffic on data interfaces is OK - All metrics are OK | 'sum_traffic_in'=105095;;;; 'sum_traffic_out'=52581;;;; 'HQ-PXY-Inet-1#Traffic-data#traffic_in'=104250b/s;;;0;1000000000 'HQ-PXY-Inet-1#Traffic-data#traffic_out'=44157b/s;;;0;1000000000 'HQ-PXY-Inet-2#Traffic-data#traffic_in'=845.74b/s;;;0;1000000000 'HQ-PXY-Inet-2#Traffic-data#traffic_out'=8424.66b/s;;;0;1000000000
Incoming traffic SUM is: 105.09 Kb/s
Incoming traffic SUM is: 52.58 Kb/s
'HQ-PXY-Inet-1#Traffic-data#traffic_in' bandwidth is: 104.25 Kb/s
'HQ-PXY-Inet-1#Traffic-data#traffic_out' bandwidth is: 44.16 Kb/s
'HQ-PXY-Inet-2#Traffic-data#traffic_in' bandwidth is: 845.74 b/s
'HQ-PXY-Inet-2#Traffic-data#traffic_out' bandwidth is: 8.42 Kb/s
Centreon configuration
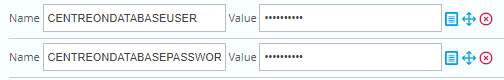
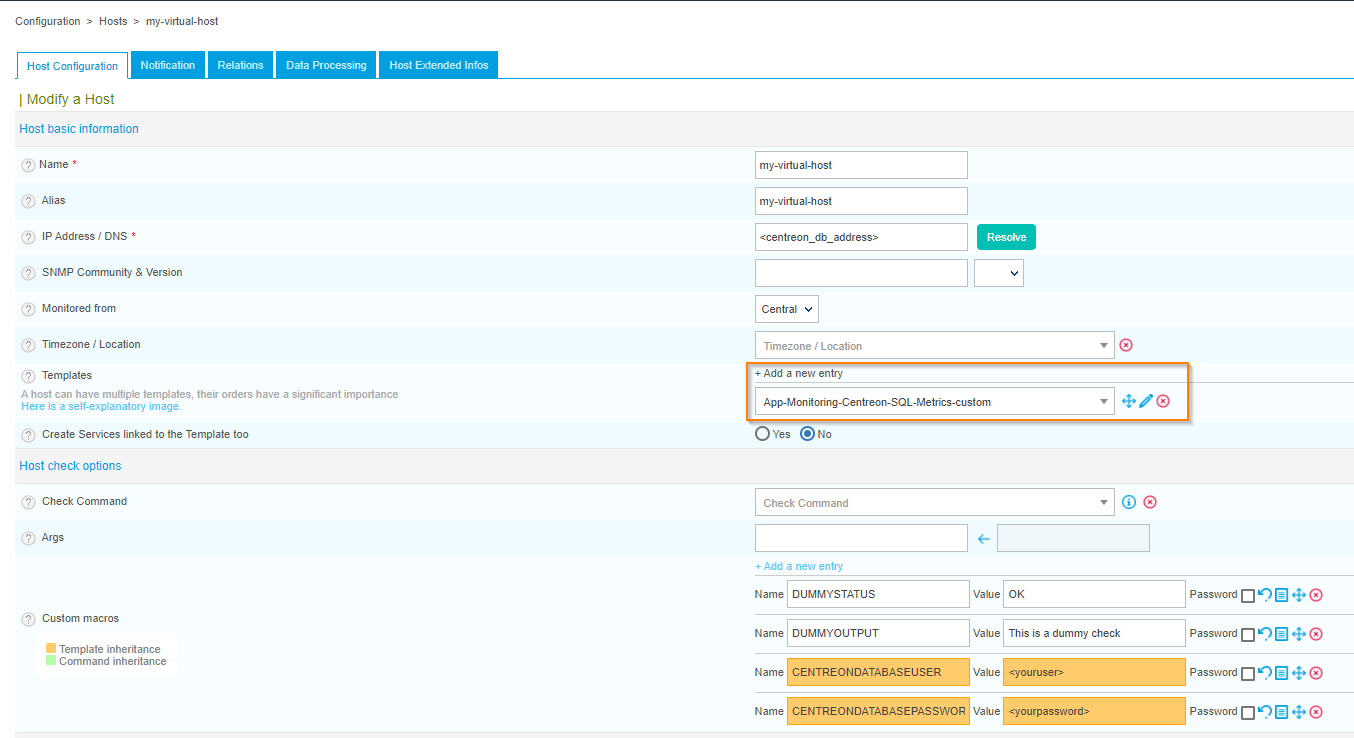
Now you can configure all of this in Centreon. Add a Host and apply the relevant template. Please fill the IP with the address of Centreon database server and set a username and a password with required privileges:
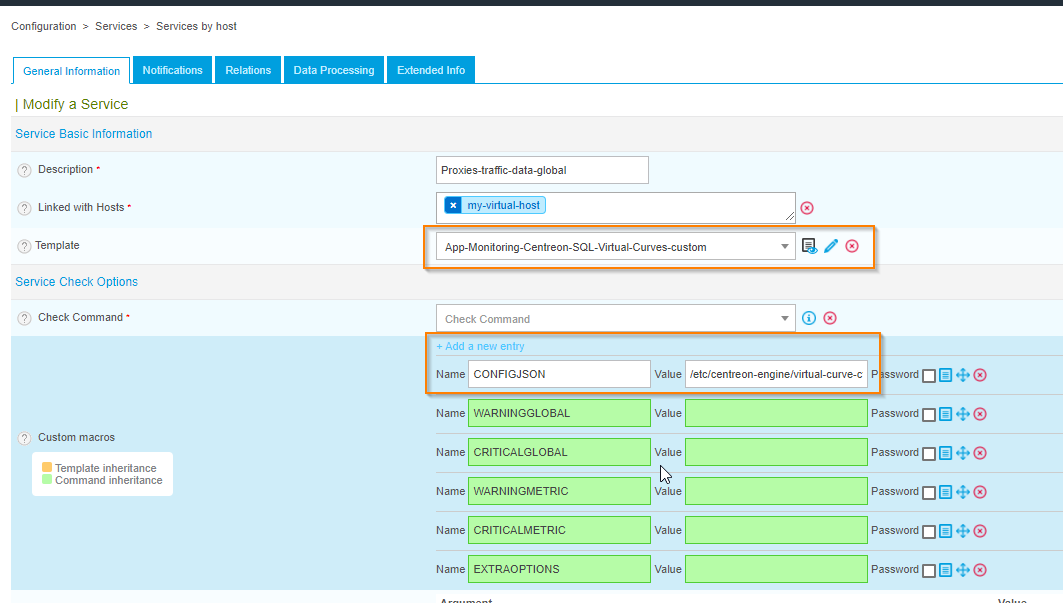
Then, create a service using the Virtual Curves template and fill the CONFIGJSON macro with the path to your config file:
Save and export your configuration.
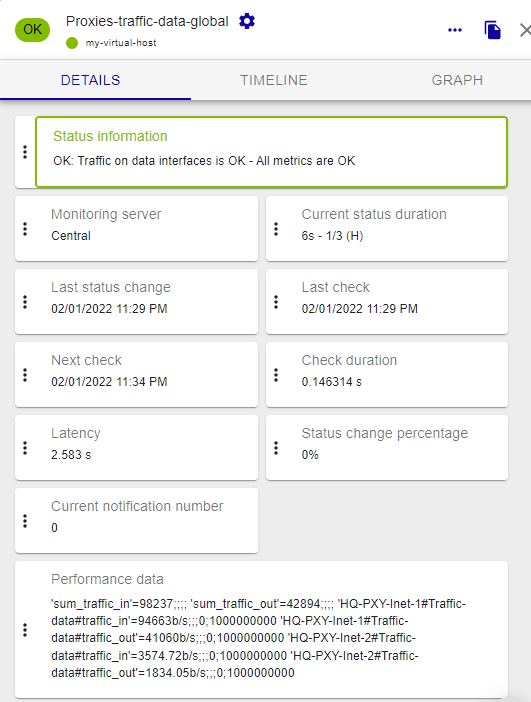
Enjoy your virtual service!
 !
!