Please note that the only procedures supported and maintained by Centreon are those published in the official documentation. If you have a question about this article, post it in the comments.
This guide will give you the keys to use the Collection mode built on top of the SNMP Protocol. If you didn't read the post showing the big picture of "Why Collection modes?" it's the advised start.
Until today, you could use numeric-value and string-value to get SNMP values. But it had several limitations, especially when dealing with complex MIB structures or a bunch of data (multiple tables with different indexes/instances, etc.). The SNMP collection aims to fix this. The only tradeoff is that it requires a separate configuration file.
The use case we will go through is monitoring the state of devices attached to a Cisco Call Manager. I know a built-in plugin exists to check that, but it's a good and clear case to understand the basics and capabilities of SNMP collection.
Prerequisites
Requirements before building a check on top of SNMP collection mode are:
- Understand the MIB file and what you want to check
- Know the basics about JSON and SNMP
- Have CLI tools to perform SNMP requests against targets
Identifying MIB and OIDs
The first thing is to identify the MIB file containing the status of the devices. Then, within this MIB, determine which OID(s) or table(s) expose the information you want to check.
Great, it looks like there is an exciting table about Call Manager attached devices:
ccmTable OBJECT-TYPE
SYNTAX SEQUENCE OF CcmEntry
MAX-ACCESS not-accessible
STATUS current
DESCRIPTION
"The table containing information of all the CUCMs in a
CUCM cluster that the local CUCM knows about. When the local
CUCM is restarted, this table will be refreshed."
::= { ccmGeneralInfo 2 }
ccmEntry OBJECT-TYPE
SYNTAX CcmEntry
MAX-ACCESS not-accessible
STATUS current
DESCRIPTION
"An entry (conceptual row) in the CallManager table,
containing the information about a CallManager."
INDEX { ccmIndex }
::= { ccmTable 1 }
The MIB file gives us a very detailed list and description of what this table contains:
CcmEntry ::= SEQUENCE {
ccmIndex CcmIndex,
ccmName SnmpAdminString,
ccmDescription SnmpAdminString,
ccmVersion SnmpAdminString,
ccmStatus INTEGER,
ccmInetAddressType InetAddressType,
ccmInetAddress InetAddress,
ccmClusterId SnmpAdminString,
ccmInetAddress2Type InetAddressType,
ccmInetAddress2 InetAddress
}
Considering what we want to monitor, we can state that we should at least focus on these OIDs:
- ccmName: The name of the device
- ccmStatus: The state of the device
When getting SNMP table information, the convention is to use the conceptual 'entry' OID. On the web or with a MIB translator, you will easily find what's the OID value for all interesting OIDs:
- ccmEntry: .1.3.6.1.4.1.9.9.156.1.1.2.1
- ccmName: .1.3.6.1.4.1.9.9.156.1.1.2.1.2
- ccmStatus: 1.3.6.1.4.1.9.9.156.1.1.2.1.5
Use the venerable net-snmp binaries from your Poller or any Linux box to check that you have the required SNMP credentials and authorization to browse these data:
[user@linuxbox ~]# snmpwalk -v 2c -c <cisco-ccm-community> <IP> .1.3.6.1.4.1.9.9.156.1.1.2.1
SNMPv2-SMI::enterprises.9.9.156.1.1.2.1.2.2 = STRING: "CUCM-DEVICE-3"
SNMPv2-SMI::enterprises.9.9.156.1.1.2.1.2.3 = STRING: "CUCM-DEVICE-2"
SNMPv2-SMI::enterprises.9.9.156.1.1.2.1.2.4 = STRING: "CUCM-DEVICE-4"
SNMPv2-SMI::enterprises.9.9.156.1.1.2.1.2.5 = STRING: "CCM-1-PUB-DEVICE"
SNMPv2-SMI::enterprises.9.9.156.1.1.2.1.2.6 = STRING: "CUCM-DEVICE-1"
SNMPv2-SMI::enterprises.9.9.156.1.1.2.1.3.2 = STRING: "CUCM-DEVICE-3"
SNMPv2-SMI::enterprises.9.9.156.1.1.2.1.3.3 = STRING: "CUCM-DEVICE-2"
SNMPv2-SMI::enterprises.9.9.156.1.1.2.1.3.4 = STRING: "CUCM-DEVICE-4"
SNMPv2-SMI::enterprises.9.9.156.1.1.2.1.3.5 = STRING: "CCM-1-PUB-DEVICE"
SNMPv2-SMI::enterprises.9.9.156.1.1.2.1.3.6 = STRING: "CUCM-DEVICE-1"
[...]
SNMPv2-SMI::enterprises.9.9.156.1.1.2.1.9.6 = INTEGER: 3
SNMPv2-SMI::enterprises.9.9.156.1.1.2.1.10.2 = ""
SNMPv2-SMI::enterprises.9.9.156.1.1.2.1.10.3 = ""
SNMPv2-SMI::enterprises.9.9.156.1.1.2.1.10.4 = ""
SNMPv2-SMI::enterprises.9.9.156.1.1.2.1.10.5 = ""
SNMPv2-SMI::enterprises.9.9.156.1.1.2.1.10.6 = ""
Perfect, we confirmed that we have all the information from the table/entry. We can start playing with the Plugin JSON configuration file.
Creating the configuration file
JSON Overview
A best practice is to create a dedicated directory on the Poller filesystem and create a file with a meaningful name:
[user@poller ~]# mkdir /etc/centreon-engine/collection-config/
sudo chown centreon-engine. /etc/centreon-engine/collection-config/
touch /etc/centreon-engine/collection-config/cucm-device-collection.json
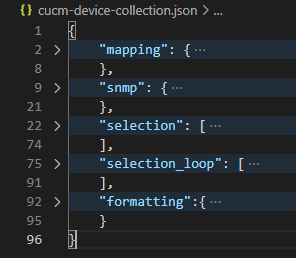
Now, let’s study see the overall JSON structure:

JSON node: mapping (optional)
The mapping node isn’t mandatory. It contains instructions to transform gathered data to a more usable/readable format.
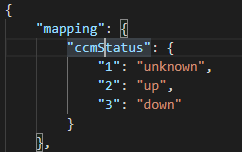
In the Cisco Call Manager use case, the ccmStatus is an integer. The OID definition describes what’s the state associated with each possible value:
ccmStatus OBJECT-TYPE
SYNTAX INTEGER {
unknown(1),
up(2),
down(3)
}
MAX-ACCESS read-only
STATUS current
DESCRIPTION
"The current status of the CallManager. A CallManager
is up if the SNMP Agent received a system up event
from the local CUCM
unknown: Current status of the CallManager is
Unknown
up: CallManager is running & is able to
communicate with other CallManagers
down: CallManager is down or the Agent is
unable to communicate with the local
CallManager."
::= { ccmEntry 5 }
We will use this section to translate this into the check:

Keep it simple. Use the OID litteral name as your mapping node definition.
JSON node: snmp (mandatory)
The snmp node is mandatory. It describes what values you want to monitor. It looks like this in the Cisco Call Manager use case:

The definition above instruct the mode to:
- Get an SNMP table (tables).
- Identify the name of the table entry (name) and the corresponding OID (oid).
- Define the instance (used_instance). In this case, this is the last digit of the OID.
- List the OIDs we want to monitor within the table (entries) with their corresponding names (name) and OIDs (oid). For the ccmStatus, you can see a reference to the mapping we defined previously (map).
JSON node: selection (optional when selection_loop node exists)
This section isn’t mandatory, but it will be present to manage the performance data and specific operation, allowing metrology over collected data.
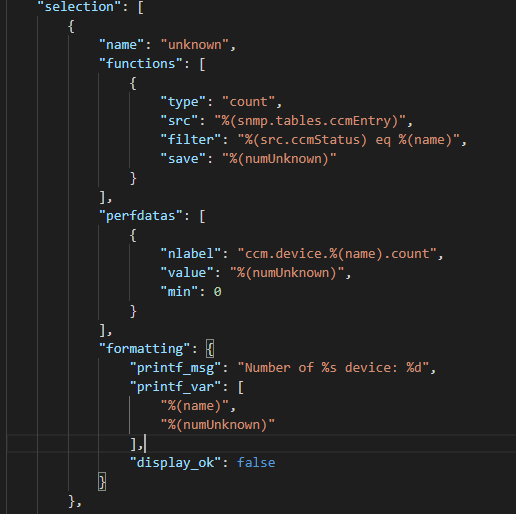
We saw that the ccmStatus might take three different values (unknown, up, or down). We will define three separate subsections to graph the number of Call Manager in each state.

Above is the subsection example for unknown Call manager devices. This subsection contains:
- A unique name definition (name).
- An array to apply advanced processing on the data through a set of predefined functions (functions). In the present case:
- We use the count function (type) and apply it to the ccmEntry table definition (src, note the specific notation and dot delimited JSON path)
- We want to increment the count when the ccmStatus OID value is unknown (filter). We use the %(name) scalar substitution, referring to the name of the subsection.
- We save the value to a specific reference to use it in the output and performance data (save)
- An array to configure the performance data (a.k.a metric), including its name (nlabel), value (value) and every other property you might need, like min or max.
- A section to define the way the mode will display collected et processed information (formatting). This section supports parameters to define mode output (printf_msg & printf_var) and provides boolean options to restrict when this message should be used (display_ok). This last instruction tells the mode only to display this specific message when a threshold is raised.
JSON node: selection_loop (mandatory if selection node isn’t set)
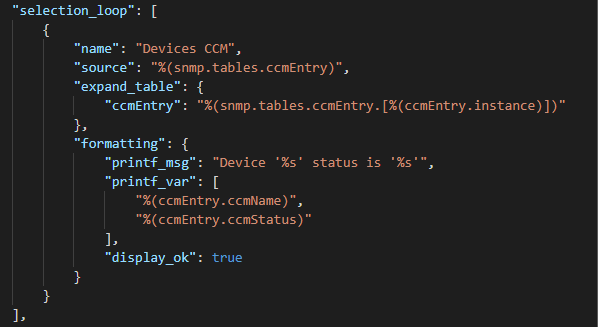
This section deals with each line of the SNMP table. Here is an elementary example for our use case:

As usual, we set a unique name (name) for the entry and what table is concerned by it (source).
The expand_tables notation offers recursive scalar expansion for each line of the table.
The formatting follows the same logic we explained previously for the selection node except that we benefit from the loop and dynamic assignment. The printf_var substitution is made thanks to the expanded ccmEntry table.
JSON node: formatting (optional)
The last section of the JSON file (in our example) is a global formatting message (custom_message_global) when everything’s OK, and there is more than one Call Manager in the table.
You can also specify the char to use to split the different parts of the output (separator)

Get and execute the Plugin
Install the Plugin by running the following command:
[user@poller ~] sudo yum install centreon-plugin-Applications-Protocol-Snmp
Make sure you have a correct and complete JSON configuration file and run the command!
In our case, it looks like this:
[user@poller ~] /usr/lib/centreon/plugins/centreon_generic_snmp.pl --plugin=apps::protocols::snmp::plugin --mode=collection \
--hostname=<my.ccm.ip.or.fqdn> --snmp-community='<community>' \ --config='/etc/centreon-engine/collection-config/cucm-device-collection.json'
As you can see, it’s exactly like any other centreon_plugins. You just need to define SNMP information (it can work with SNMPv3) and the path to your config file, and you’re done!
In my case, it outputs something like:
OK: All Cisco Call Manager devices are OK | 'ccm.device.unknown.count'=1;;;0; 'ccm.device.up.count'=3;;;0; 'ccm.device.down.count'=1;;;0;
Device 'CUCM-DEVICE-3' status is 'up'
Device 'CUCM-DEVICE-2' status is 'up'
Device 'CUCM-DEVICE-4' status is 'down'
Device 'CCM-1-PUB-DEVICE' status is 'unknown'
Device 'CUCM-DEVICE-1' status is 'up'
Wait, what about thresholds?!
Indeed, you can define thresholds! Because the mode is very flexible, it uses a constant concept to handle every situation you might imagine.
You can configure constants as many as you want. I want to hardcode thresholds to trigger a WARNING state when a device is in an unknown condition and a CRITICAL when seen as down.
To do this, add a new constants section:

And add those lines to the selection_loop node:

Yeah, these lines might scare you, but you will get used to it and write like pros with some practice!
Moreover, the first conditions are not mandatory as soon as you hardcoded constants and their values like we did here. Then, this:

Can become this:

Note that simplifying this notation implies that you will no longer be able to set constants values at runtime through Plugin args.
So yes, Collection modes indeed support thresholds, see by yourself:
CRITICAL: Device 'CUCM-DEVICE-4' status is 'down' WARNING: Device 'CCM-1-PUB-DEVICE' status is 'unknown' | 'ccm.device.unknown.count'=1;;;0; 'ccm.device.up.count'=3;;;0; 'ccm.device.down.count'=1;;;0;
Device 'CUCM-DEVICE-3' status is 'up'
Device 'CUCM-DEVICE-2' status is 'up'
Device 'CUCM-DEVICE-4' status is 'down'
Device 'CCM-1-PUB-DEVICE' status is 'unknown'
Device 'CUCM-DEVICE-1' status is 'up'
Resources and how you can help
You can download attachments to this post:
- The entire JSON configuration file from this tutorial
- An additional example to check Cisco Cisco VTP Vlan Trunking ports
You guessed it. This mode also enables you to monitor anything without writing any line of code. So, when you build a JSON configuration file that could benefit other community members, share it on centreon-plugins GitHub or in a dedicated topic on your favourite community platform!
Centreon Support does not actively maintain knowledge articles. If you have questions or require assistance with an article, please create a case or post a comment below.


