Please note that the only procedures supported and maintained by Centreon are those published in the official documentation. If you have a question about this article, post it in the comments.
This guide will give you the keys to use the Collection mode built on the SQL Protocol. If you didn't read the post showing the big picture of "Why Collection modes?", take a look at it!
Until today, you could use sql and sql-string to get simple SQL values depending on their type. But it had some limitations, and it could be hard to deal with several values and complex requests. The SQL collection aims to fix this by providing an adaptable configuration file.
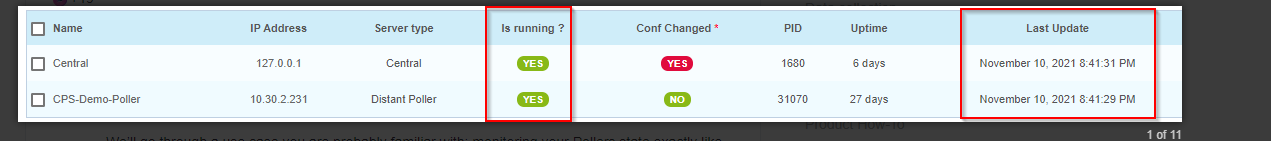
We’ll go through a use case you are probably familiar with: monitoring your Pollers state exactly like the Web UI does.

In other words, our goal is to have a service checking that Pollers are running and that the last update is not too far from the present. (Spoiler alert: a built-in Plugin exists, but this example is just great).
Prerequisites
Requirements before building a check on top of SQL collection mode are:
- Understand the data you want to check (especially their types).
- Know the basics about JSON and SQL.
- Have access to the database with required privileges.
Identifying the data
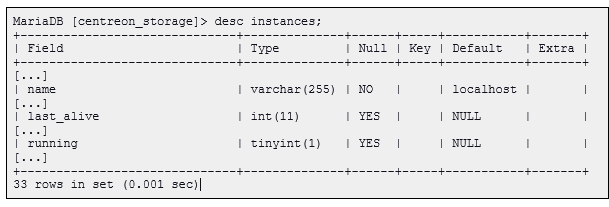
The first step is to identify the database table containing the data we want to query. In our case, it will be the instances table from the centreon_storage database (only significative fields are shown below):
Why is this information interesting? Because it’s just what we need to create a clear output message for our plugins.
We can see that there are different data types for each field:
- name is a varchar
- last_alive is an integer
- running is a tinyint
Let’s do the query to display these data:
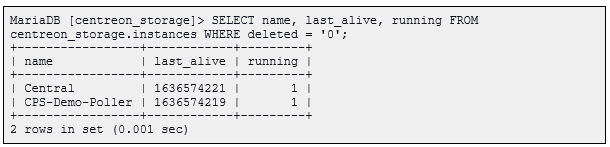
Hum, except for the name, it will be hard to display straightforward Plugin output. Moreover, we would love a graph tracking the number of seconds since the Poller didn’t refresh.
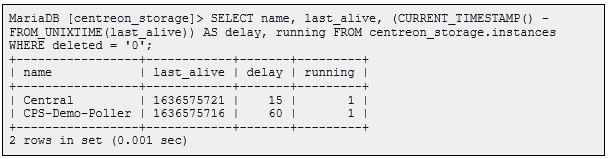
Remember that SQL has many built-in capabilities. Therefore we will use one of these to add a result column giving the number of seconds (subtract last_alive timestamp to current one):
Great, the only remaining issue is the mystery field. Let’s solve it:
- 0 will result in a “Running? No”
- 1 will result in a “Running? Yes”.
We’re now ready for the next step!
Creating the configuration file
JSON Overview
A best practice is to create a dedicated directory on the Poller filesystem and create a file with a meaningful name:
[user@poller ~]# mkdir /etc/centreon-engine/collection-config/
sudo chown centreon-engine. /etc/centreon-engine/collection-config/
touch /etc/centreon-engine/collection-config/collection-sql-pollers.json
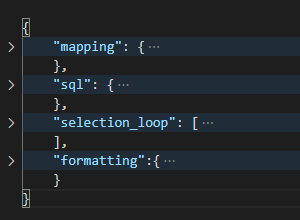
Now, let’s study see the overall JSON structure:
JSON node: mapping (optional)
The mapping node isn’t mandatory. It contains instructions to transform gathered data to a more usable/readable format.
Do you remember how the tinyint field translates? If not, the screenshot below will show you how to make it more human friendly:
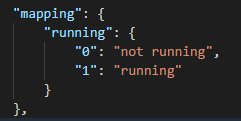
Keep it simple. Use the SQL column name as your mapping node definition.
JSON node: sql (mandatory)
The SQL node is mandatory. It describes what values you want to monitor. It looks like this in the Poller delay use case:
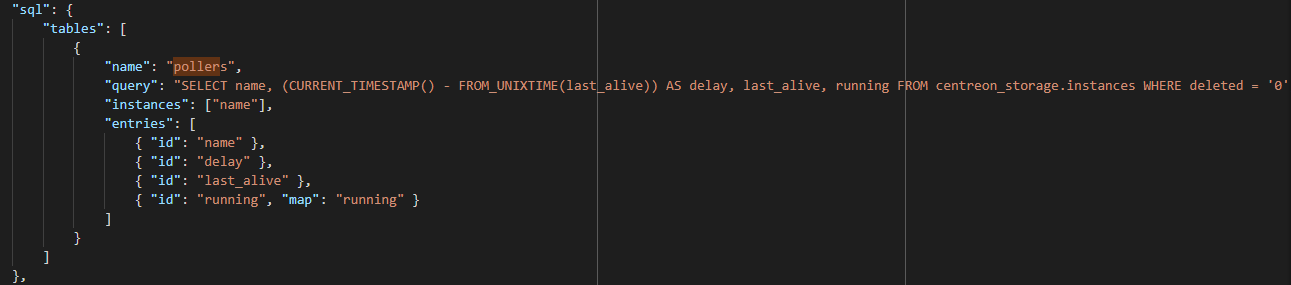
The definition above instruct the mode to:
- Get data from a SQL table (tables).
- Identify the name of the table entry (name) and the query (query).
- Define one or several identifiers for each line, here the Poller name (instances).
- Select the interesting fields (entries). For the running field, you can see a reference to the mapping we defined previsously (map).
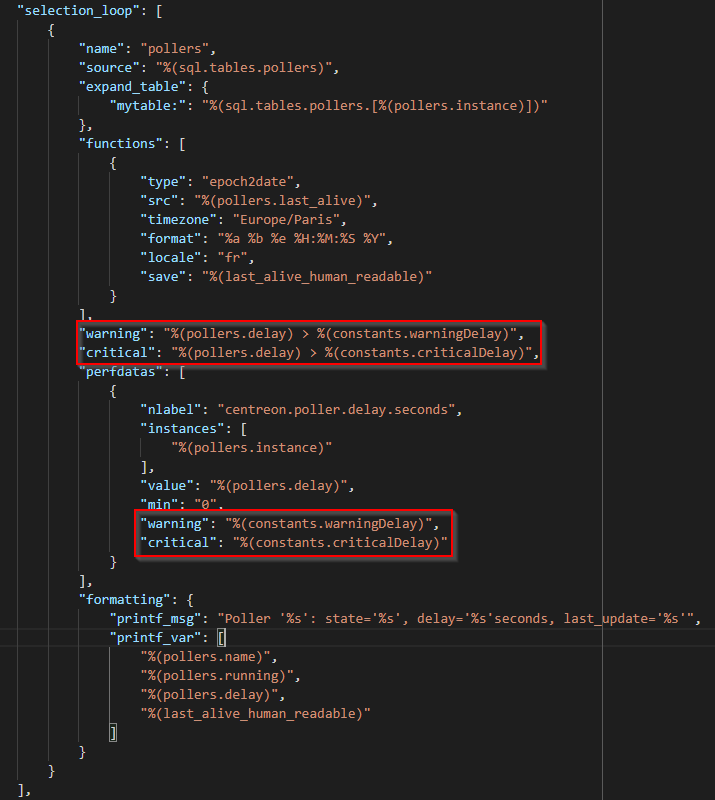
JSON node: selection_loop
This section deals with each line from the query result.
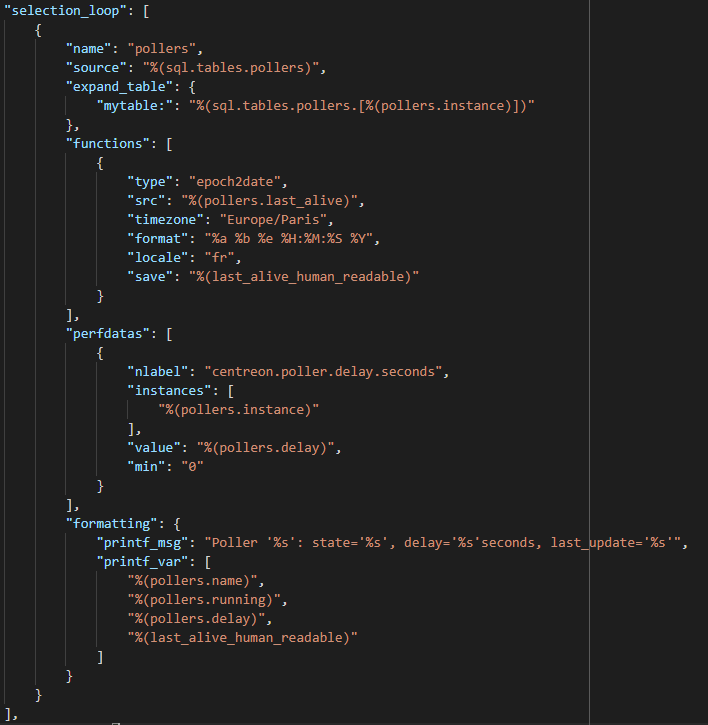
Above is the subsection example for unknown Call manager devices. This subsection contains:
- A unique name definition (name).
- The table concerned by this definition (source).
- The expand_tables notation which offer recursive scalar expansion for each line of the table.
- An array to apply advanced processing on the data through a set of predefined functions (functions). In the present case:
- We use the epoch2date function (type) and apply it to the last_alive entry (src, note the specific notation and dot delimited JSON path).
- We save the value to a specific reference to use it in the output and performance data (save).
- We also defined various parameter including the timezone, format and locale.
- An array to configure the performance data (perfdatas, a.k.a metrics), including its name (nlabel), value (value) and every other property you might need, like min or max. We refer to the previously defined instance to avoid duplicate in metrics names (instances).
- A section to define the way the mode will display collected et processed information (formatting). This section supports parameters to define mode output (printf_msg & printf_var).
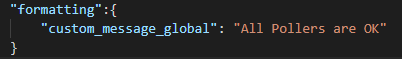
JSON node: formatting (optional)
The last section of the JSON file (in our example) is a global formatting message (custom_message_global) when everything’s OK, and there is more than one Poller.
Get and execute the Plugin
Install the Plugin by running the following command:
[user@poller ~] sudo yum install centreon-plugin-Applications-Databases-Mysql
Make sure you have a correct and complete JSON configuration file and run the command!
In this case, it looks like:
[user@poller ~] /usr/lib/centreon/plugins/centreon_databases_mysql.pl \ --plugin=database::mysql::plugin --mode=collection --host=<centreon_db_host> \ --username=’<db_user>’ --password='<db_password>' \ --config='/etc/centreon-engine/collection-config/collection-sql-pollers.json' \ --verbose
As you can see, it’s exactly like any other centreon_plugins. You just need to define SQL information and the path to your config file, and you’re done!
In my case, it outputs something like:
OK: All Pollers are OK | 'CPS-Demo-Poller#centreon.poller.delay.seconds'=69;60;90;0; 'Central#centreon.poller.delay.seconds'=26;60;90;0;
Poller 'CPS-Demo-Poller': state='running', delay='69'seconds, last_update='mer. nov. 10 22:45:58 2021'
Poller 'Central': state='running', delay='26'seconds, last_update='mer. nov. 10 22:46:01 2021'
Wait, what about thresholds?!
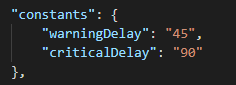
Indeed, you can define thresholds! Because the mode is very flexible, it uses a constant concept to handle every situation you might imagine.
You can configure constants as many as you want. I want to hardcode thresholds to trigger a WARNING state when a the Poller delay is above 45 is in an unknown condition and a CRITICAL when seen as down.
To do this, add a new constants section:
Then we can apply thresholds based upon these by adding additionnal definition in the selection_loop section:
So yes, Collection modes indeed support thresholds, see by yourself:
WARNING: Poller 'CPS-Demo-Poller': state='running', delay='70'seconds, last_update='jeu. nov. 11 15:27:31 2021' | 'CPS-Demo-Poller#centreon.poller.delay.seconds'=70;45;90;0; 'Central#centreon.poller.delay.seconds'=0;45;90;0;
Poller 'CPS-Demo-Poller': state='running', delay='70'seconds, last_update='jeu. nov. 11 15:27:31 2021'
Poller 'Central': state='running', delay='0'seconds, last_update='jeu. nov. 11 15:28:01 2021'
You can find the full JSON raw configuration file attached if you want to play with it!
How you can help
You guessed it. This mode also enables you to monitor anything without writing any line of code. So, when you build a JSON configuration file that could benefit other community members, share it on centreon-plugins GitHub or in a dedicated topic on your favourite community platform!
Centreon Support does not actively maintain knowledge articles. If you have questions or require assistance with an article, please create a case or post a comment below.