Please note that the only procedures supported and maintained by Centreon are those published in the official documentation. If you have a question about this article, post it in the comments.
This article is focused on Centreon troubleshooting basics and will give you the best tips to know where to look to identify issues.
Understand Centreon architecture
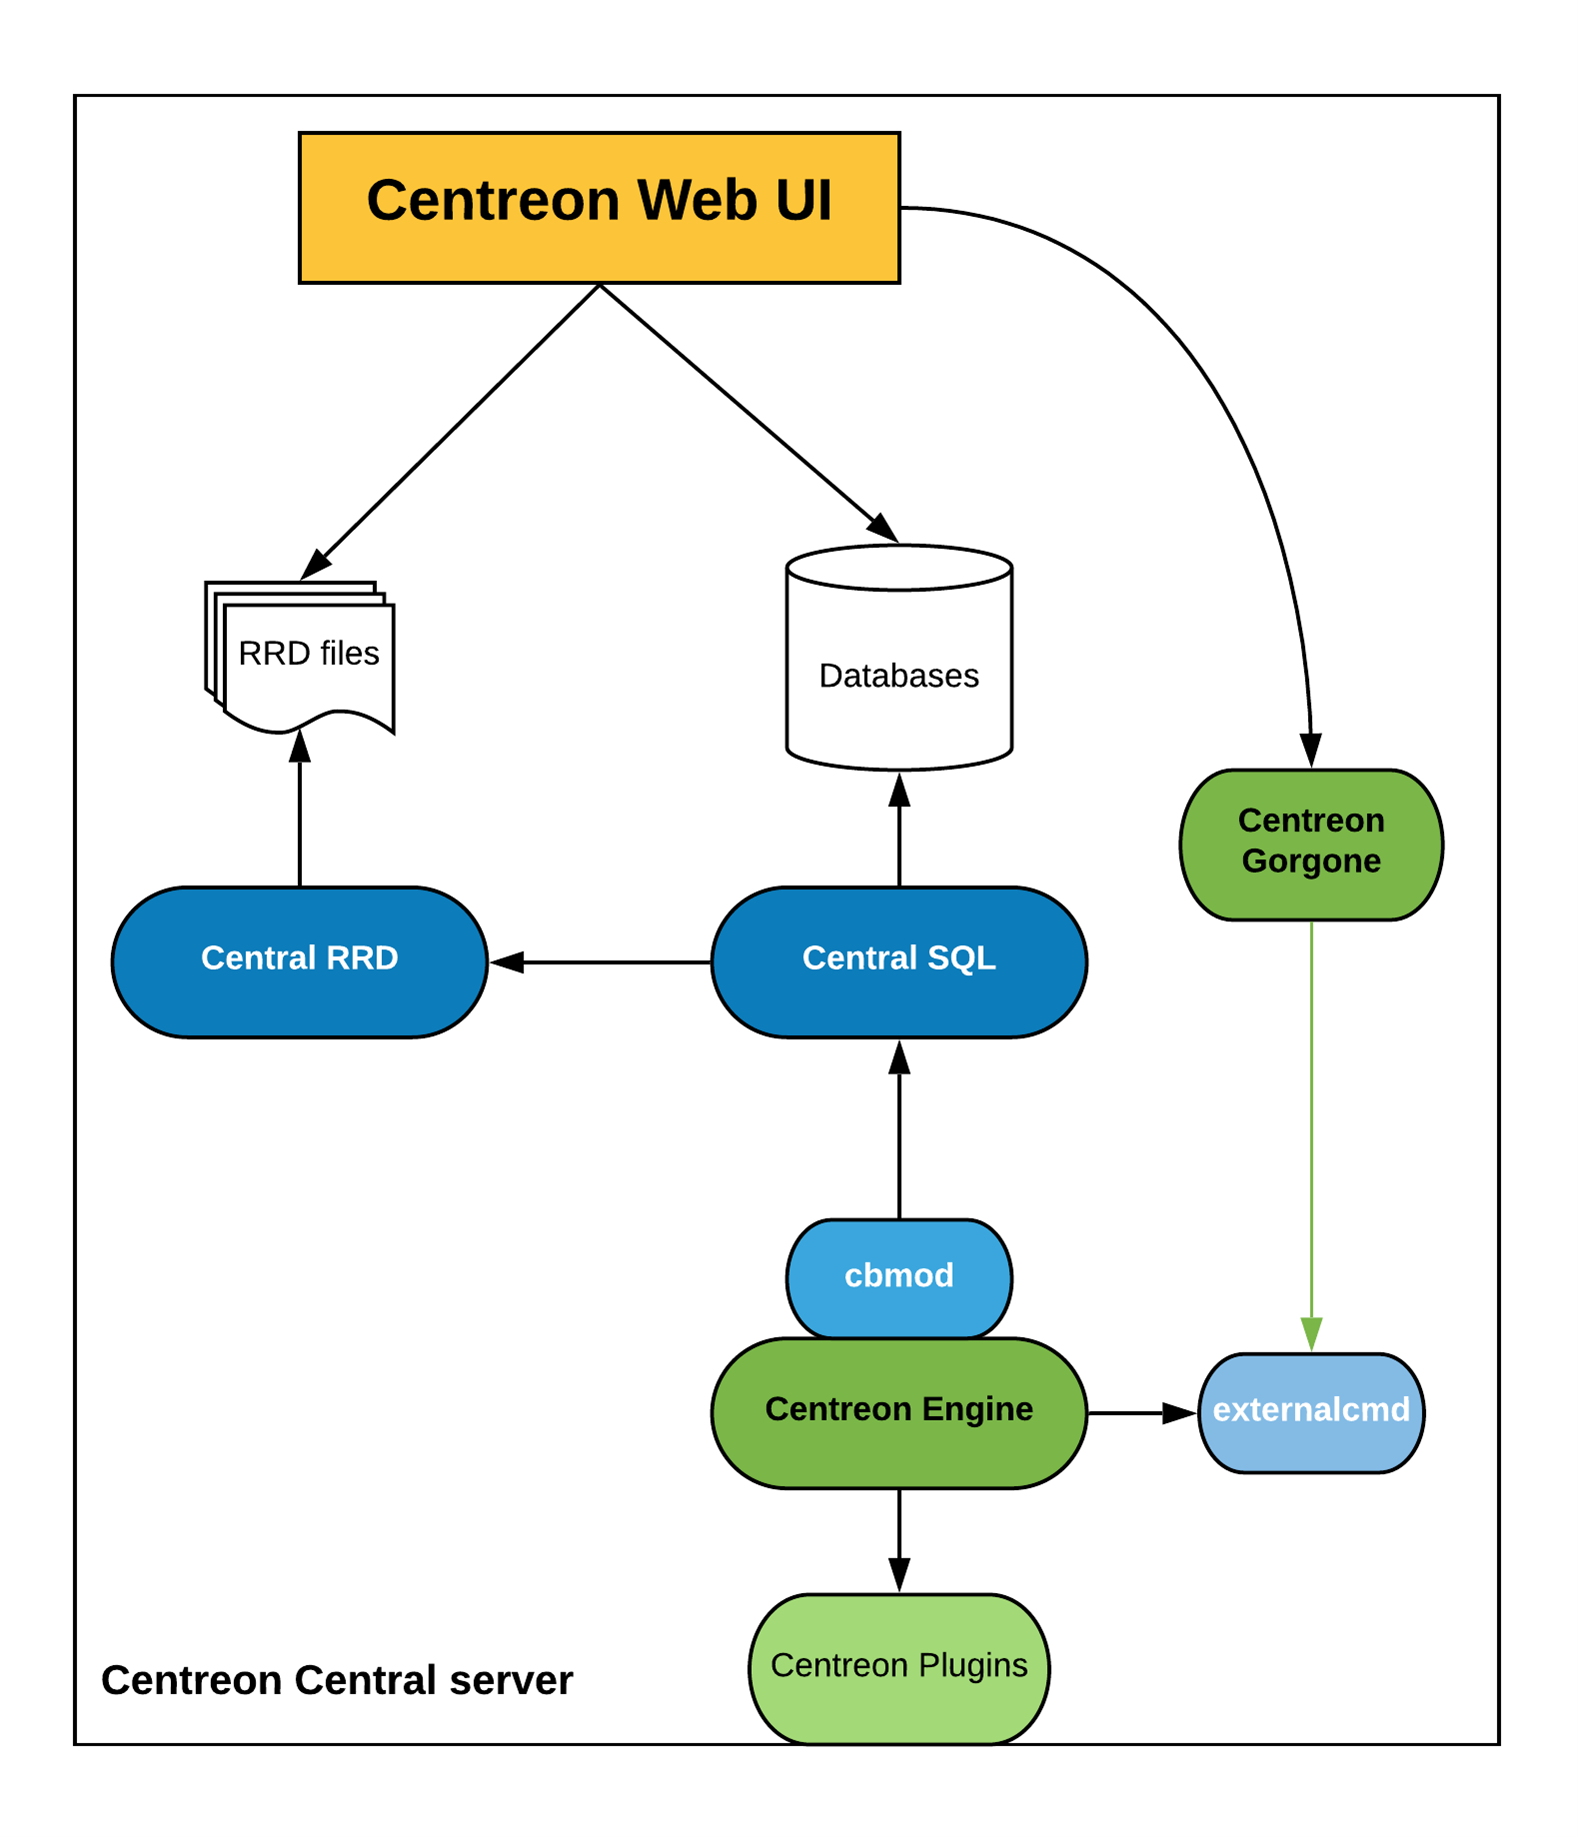
Little reminder about Centreon architecture. It’s important to have it in mind to quickly identify to what is related the issue you encounter.
Centreon depends on 3 main services:
- centengine: Centreon engine service, it schedules and executes checks to collect monitoring data and sends notifications.
- gorgoned: Centreon gorgone service, it manages central and pollers communication, as well as auto-discovery and actions done by users through UI such as Forced checks on services.
- cbd: Centreon broker is the service managing monitoring data entries to the monitoring database. The monitoring data are collected from pollers checks, they are the services and hosts status. This service also manages RDD files creation, which are monitored services status evolution graphs over time.

Exclude system issues
First, to be efficient you will need to think big before narrowing the investigation scope.
I advise you to first look at your system health status before assuming that the issue is related to Centreon software.
If system resources are fully used, it can impact Centreon software.
You can check that there is no 100% space used on any file system with the following command df -h:
[root@Centreon-Central ~]# df -h
Filesystem                                   Size  Used Avail Use% Mounted on
devtmpfs                                     908M     0  908M   0% /dev
tmpfs                                        920M     0  920M   0% /dev/shm
tmpfs                                        920M   90M  830M  10% /run
tmpfs                                        920M     0  920M   0% /sys/fs/cgroup
/dev/mapper/centos-root                      3.0G  3.0G   25M 100% /
/dev/mapper/centos-var_lib_centreon--broker  2.0G  2.0G   20K 100% /var/lib/centreon-broker
/dev/mapper/centos-var_lib_mysql             2.0G  1.3G  746M  64% /var/lib/mysql
/dev/mapper/centos-var_lib_centreon--engine  2.0G  2.0G   70M  97% /var/lib/centreon-engine
/dev/mapper/centos-var_lib_centreon          2.0G  290M  1.8G  15% /var/lib/centreon
/dev/mapper/centos-var_log                   2.0G  559M  1.5G  28% /var/log
/dev/sda1                                   1014M  192M  823M  19% /boot
tmpfs                                        184M     0  184M   0% /run/user/0
You shouldn’t be near 100% used space in the Use% column for any of the filesystem. If 100% is reached you will have to add extra space or free some space by removing files.
Check inodes usage with df -i:
[root@Centreon-Central ~]# df -i
Filesystem       Inodes IUsed    IFree IUse% Mounted on
devtmpfs         225456   281   225175    1% /dev
tmpfs            231170     1   231169    1% /dev/shm
tmpfs            231170   378   230792    1% /run
tmpfs            231170    16   231154    1% /sys/fs/cgroup
/dev/nvme0n1p1 10485232 82844 10402388    1% /
tmpfs            231170     1   231169    1% /run/user/1000
Same as df -h, you shouldn’t be near 100% inodes used in the IUse% column. If you reach 100% it means that new files cannot be created anymore. In this case you will have to deletes files or add extra space.
Check CPU and memory usage with top and free commands:
top - 15:02:17 up  4:44,  2 users,  load average: 1.77, 0.54, 0.29
Tasks: 163 total,   9 running, 154 sleeping,   0 stopped,   0 zombie
%Cpu(s):100.0 us,  0.0 sy,  0.0 ni,  0.0 id,  0.0 wa,  0.0 hi,  0.0 si,  0.0 st
KiB Mem :  1882072 total,   652680 free,   502132 used,   727260 buff/cache
KiB Swap:   978940 total,   978940 free,        0 used.  1217216 avail Mem

  PID USER      PR  NI    VIRT    RES    SHR S %CPU %MEM     TIME+ COMMAND
 7342 root      20   0  108056    596    504 R 18.8  0.0   0:00.14 yes
 7321 root      20   0  108056    596    504 R 12.5  0.0   0:15.32 yes
 7322 root      20   0  108056    600    504 R 12.5  0.0   0:12.84 yes
 7326 root      20   0  108056    596    504 R 12.5  0.0   0:05.46 yes
 7327 root      20   0  108056    596    504 R 12.5  0.0   0:05.13 yes
 7340 root      20   0  108056    600    504 R 12.5  0.0   0:00.31 yes
 7341 root      20   0  108056    596    504 R 12.5  0.0   0:00.20 yes
 3258 centreo+  20   0  723324  17172   7316 S  1.7  0.9   8:55.27 cbd
 3259 centreo+  20   0  612352  10308   8572 S  0.7  0.5   4:07.49 cbd
  978 root      20   0  228300  10912   6568 S  0.3  0.6   0:18.58 snmpd
CPU usage shouldn’t be near 100%. In the example above, you can see that the CPU usage is 100% because of the “yes” processes. With top command you can see the CPU utilization for each process and identify which processes consume too much CPU to be able to kill them.
You also should pay attention to iowait percentage, the wa value. This value represents the percentage of time the CPU is waiting for disk I/O, during this time the CPU is busy waiting and cannot perform other tasks.
[root@Centreon-Central ~]# free -mh
              total        used        free      shared  buff/cache   available
Mem:          1.8Gi       1.1Gi       262Mi       138Mi       384Mi       361Mi
Swap:            0B          0B          0B
The free command returns the memory used and the free remaining memory. You should have free memory remaining, so the used memory value shouldn’t equals the total one.
You have a full The Watch article about linux commands useful to administrate your Centreon platform :
Web UI errors
Note: commands below apply for 21.10 version. If you're using an older version, log paths and service names are different. Check official documentation for details.
For errors related to Centreon web UI, you may want to check Apache and PHP logs as well as services status.
Apache and PHP service status on Redhat 7/Centos 7:
systemctl status httpd24-httpd
systemctl status php-fpm
Apache and PHP service status on Redhat 8/Centos 8/ Oracle Linux 8:
systemctl status httpd
systemctl status php-fpm
Apache logs on Redhat 7/Centos 7:
tail -n 100 /var/log/httpd24/error_logApache logs on Redhat 8/Centos 8/Oracle Linux 8 :
tail -n 100 /var/log/httpd/error_log
PHP logs :
tail -n 100 /var/log/php-fpm/error.logtail -n 100 /var/log/php-fpm/centreon-error.log
Centreon engine troubleshooting tips
Centengine debug
Centreon engine is the checks and notifications scheduler. If your issue is related to either checks or notification, you may want to look at Centreon engine side.
First, check Centreon engine’s service centengine status to be sure it is running:
systemctl status centengineThen check Centreon engine’s log file, it could give you some hint:
tail -n 100 /var/log/centreon-engine/centengine.logBroker module loaded by centengine
Another log file to look at is the one for broker module connection. It’s thanks to this module that pollers are connected to central broker so that they can send to the central the data they collected from checks. The log file is named after the poller’s name.
tail -n 100 /var/log/centreon-broker/my-poller1-module.logYou have the same on the central for its own connection to broker:
tail -n 100 /var/log/centreon-broker/central-module-master.log“Not Running” poller issue in the web interface
A common issue is where the poller appears Not running in the configuration export menu.
We have a full troubleshooting guide about this particular issue:
Notification issues
If you have issues with notifications that are not sent, you may want to check if the service supposed to send notification is running. For example, with postfix:
systemctl status postfixYou can take a look at postfix configuration to ensure you’ve configured the relayhost:
cat /etc/postfix/main.cfYou can also verify that you don’t have any firewall or iptables rules preventing notification sending:
iptables -Lfirewall-cmd –list-allYou have all network flows and used ports on the Centreon official documentation : https://docs.centreon.com/docs/installation/architectures#tables-of-platform-flows
After that, you can check manually if the notification are being sent with the following command:
echo "This is a test" | mail -s "My subject" yourmailaddr@youroffice.comYou can check that the mail was sent in the mail log file:
cat /var/log/maillog
Centreon gorgone troubleshooting tips
Centreon gorgone service manages central and pollers communication, discovery and actions done by users through UI on Centreon engine like Forced checks on services.
First, to check if Centreon gorgone is running:
systemctl status gorgonedTo catch the errors gorgone might log, you can run tail -f on gorgone’s log file while doing the action that doesn’t work. For example, a forced check that is not executed or a discovery job that is stuck:
tail -f /var/log/centreon-gorgone/gorgoned.logIf you have to do any modifications to gorgone’s configuration files, don’t forget to restart gorgone service:
systemctl restart gorgoned
Centreon broker troubleshooting tips
Centreon broker manages monitoring data entries to monitoring database. This service also manages RRD files creation, which are monitored services status evolution graphs over time.
You might think that you have issue with Centreon broker if the monitoring data in resource status page is not up to date.
First, check that Centreon broker is running:
systemctl status cbdThen, the following log files might help you identify the root cause of your issue:
tail -n 100 /var/log/centreon-broker/central-broker-master.log
tail -n 100 /var/log/centreon-broker/central-rrd-master.log
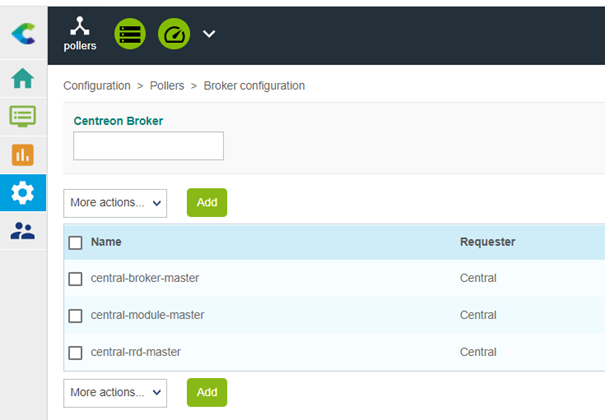
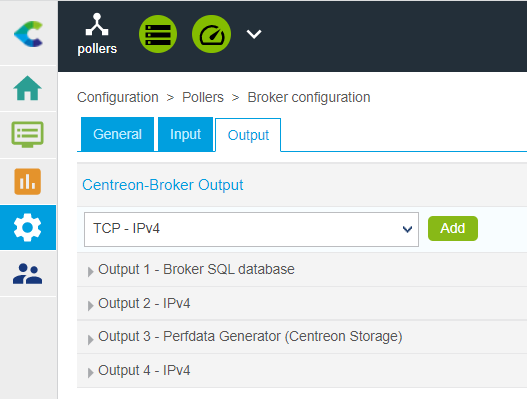
A common issue is a broker output missing or misconfigured. You can find them in Configuration > Pollers > Broker configuration.


Don’t forget to export the configuration if you have to do any modification here, and restart cbd service:
systemctl restart cbd


