I would like to request some information and I thank you in advance for following up on my request, I am supervising a service by OID and I have encountered several cases in this task,
1- in Output the value obtained is in MB whereas I would like to display it in TB.
2 - using numeric-value I manage to obtain the graphs but you have to put several options to obtain the desired value.
3 - using String-value I obtain the desired value but there is no graph for this service and for me it is essential to have a graph for analysis.
Conclusion: I would like to be able to convert the Output from MB to To / Obtain a Graph for the service using String-Value
Page 1 / 1
Hello
you are using the wrong mode, you should use numeric-value and not string-value. (string value is only a string, no metric, while numeric-value will return the necessary information to create a graph)
--format-custom=’* 1024 * 1024’ this will multiply the value reported by 1MB (to get the byte count, centreon will need bytes in order to format the value to KB/MB/GB human readable)
--format-scale (this will try display the value with the correct unit from the bytes value)
--perfdata-name=’something’ (this will be the metric, for storage usage, i advise ‘used’ but this is what you want to display)
you may need to play around with the parameter, be sure your OID returns MB and not something else (I know some storage that will return a number of bloc and you need to multiply by something else than 1024 (ex: Huawei with 512B blocks)
Hello :)
I’m not able to answer to the whole issue but about the output conversion from MB into TB maybe the option `--convert-custom-values` can do the job if you add something to calculate the value in the new unit.
--convert-custom-values Custom code to convert values. Example to convert octet string to MAC address: --convert-custom-values='join(":", unpack("(H2)*", $value))'
@christophe.niel-ACT
Thank you for your feedback, it made me understand but I still have some difficulties which I hope you can instruct me on.
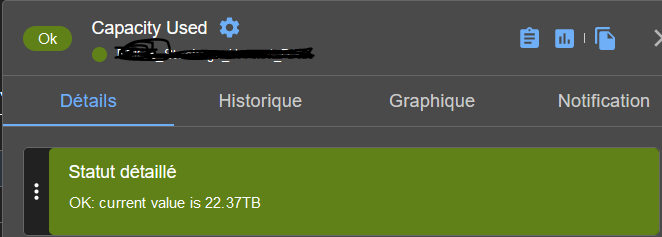
as mentioned in the screenshots: when I insert the warning and critical thresholds it displays that it is critical even though this is not the case and if I delete them the status returns to OK.
the last case is these results are only in the command line that I insert the --format-custom option in the UI for example it is not saved and it is not taken into account after saving or export the config of the poller concerned
I hope that I have been clear in describing the blockage to you and that you can help me with this.
@ldubrunfaut Thank you for your feedback, please can you be more clear? This option did not work, please explain more
I try to find in string-value mode an option to allows you to do the convertion your want to do (MB into TB) and this one sounds to match with the issue. I’ve never used it so my answer is totally theoretical but the way I understand the option you can do something like this :
--convert-custom-values=$value/1048576
That supposes your $value is indeed MB. But as @christophe.niel-ACT said string-value may not be the appropriate mode in your case :)
just as a real life example, here is an OID snmp that get a value
if I simply add “--format-scale” as an extra option :
now, imagine my value was in MB like you, I should get a 3.67Peta, so I added
--format-scale --format-custom='* 1024 * 1024' in the snmp extra options
this now automatically converted to TB in the display value, and the metric value is in Byte, so need to add B with the option --metric-unit=’B’
it now looks like I have a nice text that will show warning, critical an OK automatically, then it will make a graph with the Bytes value (centreon is woking with the bytes value to make graphs, not MB, TB, or other unit like that, it automatically adapt the text to the appropriate human readable text)
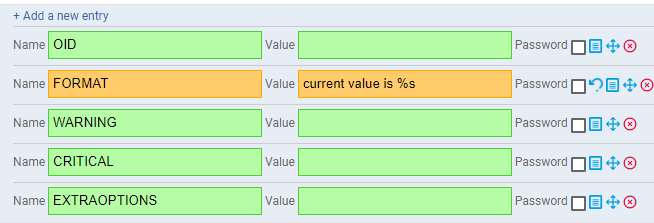
if you look at the service template for numeric value you have this :
so you would need to add the formatting in EXTRAOPTION
and adapt the orange Format with your own text like you did
at no point do I use any conversion on the displayed Text, and you need to convert your non Byte value to bytes so the data is stored correctly in the database
@christophe.niel-ACT This is exactly what I needed, I thank you very much for the details now I have the values in TB with the exact graph,
just the last thing when I add the thresholds of Critical='90' and Warning='80' the state goes back to Critical automatically and when I remove them it goes back to Ok as shown in the captures :
ah, you cannot use “80” and “90” as a threshold for warning and critical, these are percentage, and the plugin has no way to know the size so it cannot computer 80% or 90%
if you put 80 it will be 80 bytes
you need to input the correct value in byte that will correspond to your 80% and 90% usage and calulate it manually, that’s a limitation of this “generic snmp”
but why are you using the generic snmp ?
just so you know, I recognize this OID manufacturer, did you try the existing plugin, it looks like huawei storage, have you tried this plugin?
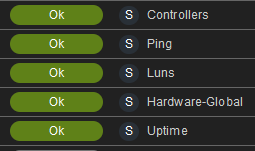
this plugin has a few check like hardware and can report space usage for LUN and Storagepool (I worked on some times ago to include this in the plugin)
I was working on a restapi version of this plugin instead of snmp but I had other stuff to do so it is on hold right now, but I think I was including the complete size of the system usage (what you are requesting with your OID), this is not in the SNMP plugin, but maybe the StoragePool usage from the snmp plugin may also work for you?
Good morning @christophe.niel-ACT ,
I am trying the thresholds and it gave no results either by putting the thresholds by bytes or To I don't know which form will accept I only wanted to answer you regarding the plugin:
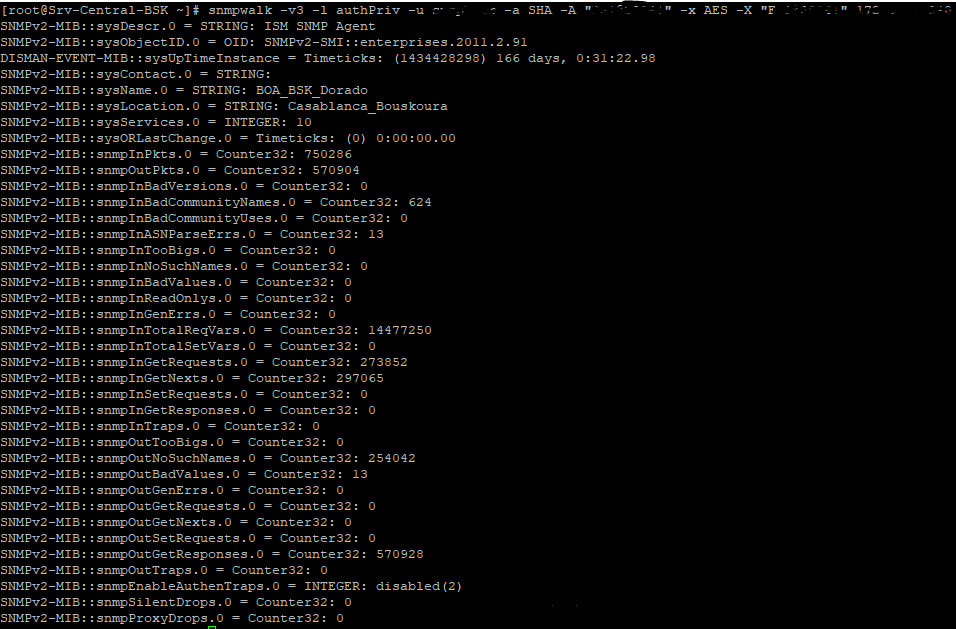
by launching the command snmpwalk centreon cannot browse the entire MIB of the Storage Bay (see screenshot), and I don't know if it's a problem of kernel locking by the manufacturer or a bad configuration of their go.
As a result, I cannot trace certain services via SNMP and I have to supervise them via OIDs.
if Centreon was able to provide me with all the services using the plugin as you mentioned to me, it would have saved me all this trouble (it's still good to confront all that to learn these tips)
Now I am monitoring the total capacity of the bay and the FC ports, this is the important thing that the plugin was not able to tell me.
for the LUNs and storage pools I was able to supervise them using the plugin.
Yours sincerely
I am trying the thresholds and it gave no results either by putting the thresholds by bytes or To I don't know which form will accept
you need to input the value as based on the same raw value from the snmp query
in your case you get a value in MB (which converted to bytes for the graph, and displayed as TB), so your warning and critlcal should be a number matching the 80% and 90% of the totalcapacity in MB
you can get the exact total capacity value for your storage system with the oid
you are getting the .4 oid value which is usedCapacity, and if you snmpwalk this oid you will get the total
simply caculate the number for 80% and 90% of that value, and put the number in the warning and critical value (no unit needed)
Hello @christophe.niel-ACT
sorry for the late response I had some complications with the whole platform.
although the first tests of your last answer were not conclusive and I don't know why but I understood the concept and I will continue to test until I obtain the desired result.
Only I have one last question on this subject, for example can I combine several OIDs in the same service? for example total, used and free?
Or is it not possible at Centreon?
Only I have one last question on this subject, for example can I combine several OIDs in the same service? for example total, used and free?
this is a bit complicated, it requires you to create a json file (you need to put that file on the poller) and then pass the name of the file to the check snmp command
the hard part is building the JSON file. The tutorial written bu centreon I linked above covers the basic usage of this method, but you can declare multiple OID, do computation with function, format your output, etc…
the only issue is that the tutorial explain how to use a “snmp table” which has multiple entries
in your case, you only have a 2 flat snmp oid to read to get the used and total, so you would need to try different syntax, or ask for help on how to implement the JSON collection (which I can”t really help you with, sorry)
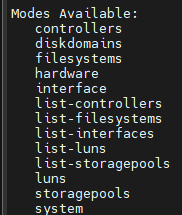
(the “lun” and “storagepool” mode for example was my own contrib)
it is way harder to do it this way though because you would need to know Perl, and understand the way centreon plugins are made.
they created the collections to allow you to make new plugins without the hassle of learning perl
and I realize something… I almost already made all the work last year as I was looking in an snmp alternative for huawei, it is not yet finished 100% but it is working well enough, I need more work on some information, but here are the mode I created using the https api :
the “system” mode return the status and consompution of the array in this format :
I also have the network interfaces and autodiscover working, and I have traffic monitoring, plus traffic
and of course all the storage usage on all level, storagepool, controller, lun, status,
basically all is working except I’m having difficulties with the threshold warning/critical on the storage
metrics, I’’m having issue understanding how this work in the centreon plugin inner work
I would need some time to work on this plugin to finish to code it…
If it could be of use for you can put in on my git but it is “as is” for now, a few unfinished thing and no alert
Hello Again @christophe.niel-ACT ,
very interesting your really great achievements,
For me, I haven't yet delved very deeply into centreon because the platform is brand new to our company, only a few months old.
To give you a quick overview, the idea of this project is to supervise the FC ports of the storage bay following incidents that have occurred and this will allow us to future analyze the cause of these saturations.
I was able to have them easily for example for SAN Switches through automatic discovery but at the bay level I can't figure out where the idea of supervising them via OIDs came from
currently I was able to monitor the total bandwidth passing through these FC ports (average Write and Read)
but I noticed that you supervise the traffic of the CTE0 cards and I believe that these are the cards where the FC ports are connected according to the explanation of the storage team or am I wrong?
regarding development personally I am a long way from that but I will see your instructions with the developers of my teams to go deeper in this direction
For notifications, I too am still working on that but still no results, but initially we have DATA to analyze in case of need or incident